
We all know by now that the economy is cliff-diving. Many bloggers can ably describe the dive in progress. One of the distinguishing things I have been trying to do over the last year is to look ahead to determine, "Where is the bottom of the cliff, and When do we get there?" Unlike most recessions, which might be described as bungee-jumps, where you get to the bottom and rebound quickly, this recession heralds a secular change, as housing and financial bubbles burst. In those circumstances, typically there is a crash or cliff-diving stage (also described by Russ Winter as the "guillotine" phase) followed by a slower, more sideways, grinding stage (described by Russ Winter as the "sandpaper" stage). Or, as I've described it many times, a Slow Motion Bust.
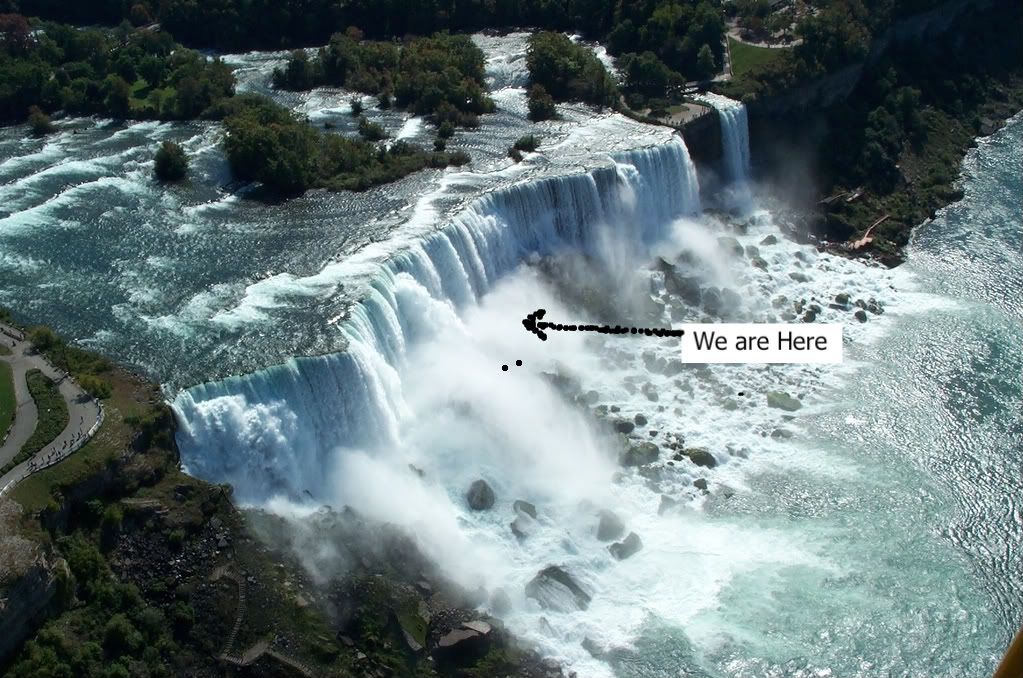
A more visual depiction of such crashes is to liken them to going over the American falls. First there is the free-fall, then the bouncing to the bottom of the rubble. For example, in my last blog, I noted how new home sales almost had to be nearing the bottom of the cliff. Or, visually:
Another recurring theme of my blog entries is that recessions and recoveries tend to follow similar patterns, described in research and apparent in the data. Most to the point: residential investment tends to be the first to turn down before a recession, and the first to begin to recover during a recession. This point was reiterated just the other day by Calculated Risk, who noted: "residential investment is the investment area to follow - it is the best predictor of future economic activity." Here's his graph:
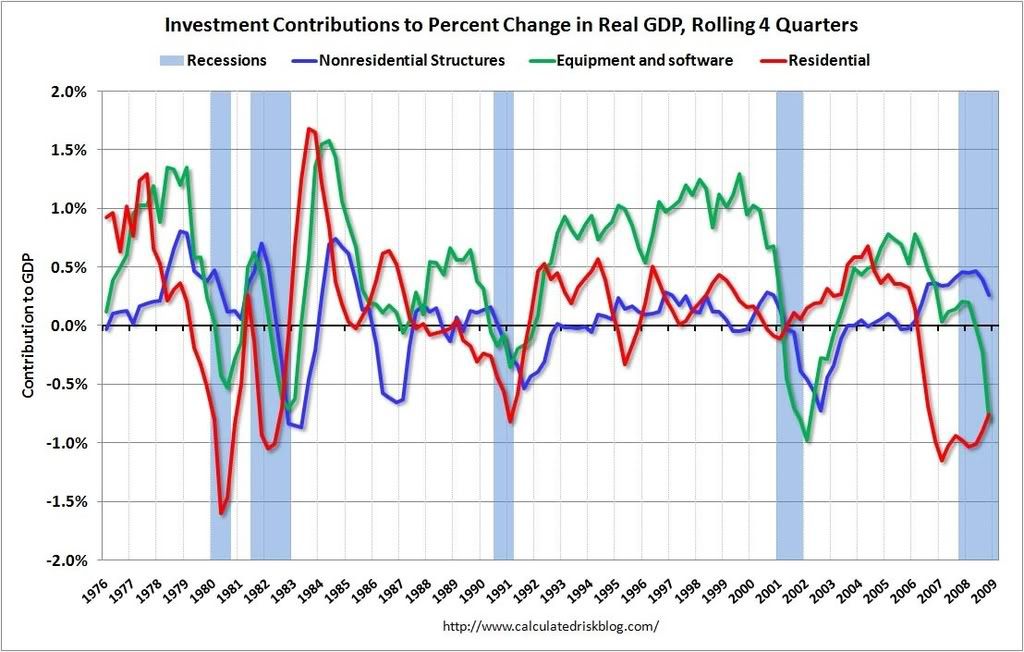
It's easy to see on this graph the real residential investment tends to peak long before the onset of recession, and more frequently than not turns upward (on a relative basis) well before the recession ends.
A similar pattern can be seen on this graph of real residential investment dating from 1929 (Note from 1929 to 1947 the series was only determined annually. The successor series is updated quarterly. I have omitted 1946-47 because the immediate post-WW2 boom would dwarf all other entries):
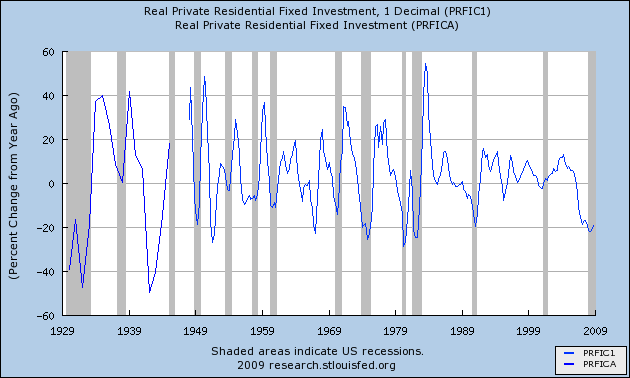
Although on CR's graph, it appears that residential investment already hit bottom, his graph only dates from 1976. The graph immediately above shows that similar patterns of residential investment meandering along a bottom occurred before and during the 1957 and 1973-74 recessions (not to mention the Great Depression). So it is way too early to call a bottom.
On the other hand, a few months ago, when I first noted that housing appeared ready to transition from crash to rubble-bouncing, I included a graph of the long term trend in private residential investment. Now I can update the graph, and the updated information is dramatic:
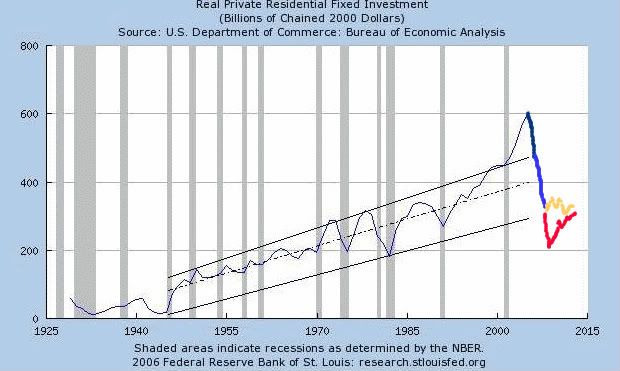
In 2008, real residential investment fell right through the upper trendline all the way to the lower trendline (blue update). From here it is likely to take one of two paths: either fall swiftly through the trendline in a mirror image of the bubble to a bottom, before swiftly returning to the lower trendline (red line); or else bouncing along the rubble at or near the lower trendline (flesh tone line).
Either way, it would be nearly impossible for there not to be a large rebound on a year-over-year percentage basis at some point by the end of this year. With the sole exception of the Great Depression itself, this would give us a powerful signal that the recession is bottoming, that the deterioration in the economy is nearing an end, and that at least an anemic recovery was set to begin.
Comments
severe credit contraction
Thank you for your efforts.
But, wouldn't a severe credit contraction be a big factor in determining what kind of recovery we have?
RebelCapitalist.com - Financial Information for the Rest of Us.
Absolutely
Until the excesses of debt/leverage are worked out of the system, I expect any recovery (recovery meaning positive numbers, i.e., a lack of further deterioration) to be anemic.
This analysis works if we are in
a typical recession and applying the same rules of any past recessions and comparing data to look for those similarities perhaps a case can be made.
However, I think we are beyond the typical recession where the old comparisons no longer work. CA has an umemployment rate of 10.1% which should tell you that we are now in a soft depression even by the governments watered down calculations.
The trends and solutions of a depression are quite contrasting to that of a recession.
Housing values are still over priced to todays diminished incomes and the majority of the corrections have taken place in the subprime neighborhoods covered under F & F loans. We have yet to see the next level of correction in the Jumbo markets and areas where there were higher credited borrowers. Those of the Alt-A variety.
It has always been about class warfare.