Are we witnessing the corruption of central banks? Are we observing the money-creating powers of central banks being used to drive up prices in the stock market for the benefit of the mega-rich?
It's Friday Night! Party Time! Time to relax, put your feet up on the couch, lay back, and watch some detailed videos on economic policy!
Earlier Economist Ralph Gomory publicly stated we all should respect Occupy Wall Street and pointed to the history of protest in the United States. Gomory's article reminded me of the Great Depression and the Hoover administration's lack of responsiveness to the people, in particular WWI veterans. The vets were desperate for money and wanted to receive their military service bonus checks early. They were refused and this ignited a protest by the WWI veterans called the Bonus March.
A frequent meme propounded in the economic blogosphere is that U6 unemployment, running near 17% now, is a truer measure (and there are good reasons to believe it is), so that means we have unemployment already approaching Great Depression levels of 25%. Left out of the comparison is the fact that U3 and U6 measurements didn't exist during the 1930s. So, is the 25% unemployment peak for the Great Depression a fair comparison to U6 unemployment today?
In Part I of this series, Bonddad and I looked at the years 1929 - 1933. These years saw a decline of 25% in the chained GDP figures; a failure of 20% of commercial banks, a drop in personal income from $90 billion to $50 billion and a drop in the level of industrial production from 60 to 30. In
part II we looked at the years 1934 - 1940, where we saw that growth returned to 1929 levels in 1937, although this was lowered by the recession of 1938. By 1939 GDP was again increasing. In Part III, we looked at what happened statistically and practically during the years of 1934 - 1938.
In this, our 4th and final installment, we expose and rebut the lies and distortions of the RW noise machine New Deal denialists.
In Part I of this series, Bonddad and I looked at the years 1929 - 1933. These years saw a decline of 25% in the chained GDP figures; a failure of 20% of commercial banks, a drop in personal income from $90 billion to $50 billion and a drop in the level of industrial production from 60 to 30. In
part II we looked at the years 1934 - 1940, where we saw that growth returned to 1929 levels in 1937, although this was lowered by the recession of 1938. By 1939 GDP was again increasing. In this article, we will look at what happened statistically and practically during the years of 1934 - 1938.
In Part I of this series, Bonddad and I looked at the years 1929 - 1933. These years saw a decline of 25% in the chained GDP figures; a failure of 20% of commercial banks, a drop in personal income from $90 billion to $50 billion and a drop in the level of industrial production from 60 to 30. The contraction was the most severe of the last 100 years. Let's take a look at years 1934 - 1940 to see how the economy performed.
''At the end of February, we were a con-geries of disorderly panicstricken mobs and factions. In the hundred days from March to June we became again an organized nation confident of our power to provide for our own security and to control our own destiny.'' - Walter Lippmann, 1933
The Hundred Days were only the start of a process that ended by transforming American society.
This article is the first in a series on the Great Depression. I am collaborating on this series with Bonddad. The purpose of this series is simply to talk about the Great Depression. The reason for writing this article is the emergence of the "FDR made the Depression worse" talking point from the Right Wing Noise Machine -- econ division. While none of the stories using this line have an facts to back them up -- no charts, no graphs no data -- they continue to spew this talking point. So, let's get some data -- as in facts -- to see that actually happened.
I've taken Mike Shedlock a/k/a Mish to task on a couple of items lately. But one of his graphs tells a very interesting and timely story that is worth a little more in-depth discussion.
Most people who have read about the Great Depression understand that part of what happened is that the money supply (M1 and M2) contracted sharply and that there is a school of thought that this was a prime driver of the Depression. But then there's the anomaly shown in this graph:
As I will discuss below, the two spikes in the monetary base - in December 1930 and October 2008 - have a lot in common.
In The 1920s Credit Bubble, I explained how a credit binge gave rise to serial bubbles in housing, durable consumer goods, and the infamous stock bubble of the 1920s. Last week in The Panic of 2008: a Turning Point I gave a big picture overview of how our current credit crunch is unfolding. At that time I pointed out that there were some important differences between our credit crunch, and the collapse of the 1920s credit bubble into the Great Depression. The goal of this diary is to peer into our near future by means of a chronological examination of how the apparently mild if abrupt downturn that began in late 1929 transformed into a much more serious downturn that ultimately snowballed into the Great Depression, during the year following the stock market crash, 1930.
I. Introduction
Imagine it is a time like now, where there has been a remarkable credit binge that has ended in dramatic fashion, with the stock market suddenly crashing and losing 1/3 of its entire value. Consumers are saddled with debt, as are many who speculated on the newest baubles on offer by Wall Street. The assets pledged as collateral to back up the loans that went to buy both the consumer and financial baubles is caught in a vicious downward spiral. Eventually, and very soon, all of this bad debt is going to have to be liquidated, and both debtors and creditors may go under as a result.


 It's Friday Night! Party Time! Time to relax, put your feet up on the couch, lay back, and watch some detailed videos on economic policy!
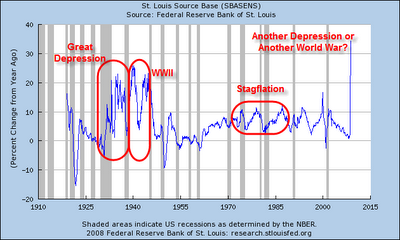
Recent comments