The Chicago Fed National Activity Index, often referred to as the CFNAI, was released today with a –0.06 value for July. June was -0.38, so the monthly index shows some economic conditions improved from last month, although still nothing to write home about. Below is CFNAI graphed against real quarterly GDP percent change.
The Chicago Federal Reserve's National Activity Index (CFNAI) came in to -0.07, up from a revised February, of -0.44. The CFNAI-MA3 means the 3 month moving average of the CFNAI. This index is volatile, so the three month moving average is typically the more important metric.
The index’s three-month moving average, CFNAI-MA3, increased to –0.18 in March from –0.31 in February. March’s CFNAI-MA3 suggests that growth in national economic activity, while still below average, continues to improve. With regard to inflation, the amount of economic slack reflected in the CFNAI-MA3 indicates subdued inflationary pressure from economic activity over the coming year.
Production-related indicators made a contribution of +0.18 to the index in March, compared with +0.04 in February. Manufacturing industrial production increased 0.9 percent in March after increasing 0.2 percent in February, and manufacturing capacity utilization rose to 70.0 percent in March from 69.4 percent in the previous month. The manufacturing capacity utilization rate in March reached its highest level since November 2008.
Led by declines in production-related indicators, the Chicago Fed National Activity Index decreased to –0.64 in February, down from –0.04 in January.
Three of the four broad categories of indicators that make up the index deteriorated, and only the sales, orders, and inventories category made a positive contribution.
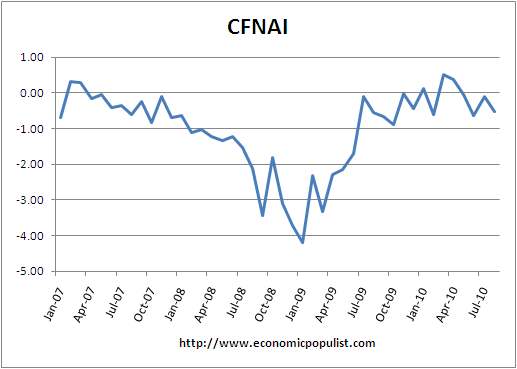
The three month moving average is also down, -0.39 but is still at it's highest point since December 2007, the mark point start of this recession.
Chicago Fed National Activity Index was released today and the headlines will surely blare that the economy is moving towards pre-recessionary levels.
Myself, I want to amplify there are two indexes, the first is this months national economic activity index and then the CFNAI-MA3, which is a 3 month moving average of the CFNAI. The monthly index has statistical noise, so the moving average is the number cited.
The September 2009 3 month moving average implies economic recovery. Anything above -0.70 is good.


Recent comments