The Federal Reserve is publishing a 0.2% increase for August 2010 in industrial production Here is a detailed report. Last month's blow out was revised significantly, from 1.0% to 0.6%.
Whoop-de-do! I have no idea why some of the financial press headlines buzz industrial production has incredible gains. The Federal Reserve is publishing a 0.1% increase from last month. That ain't no blow out. Here is the detailed report.
Snow, snow, look at the snow. This is a line from a pre-school first reader book and the last economic indicator reports are quite similar. All of a sudden everything is blamed on the weather, in a repetitive, rhyming pattern.
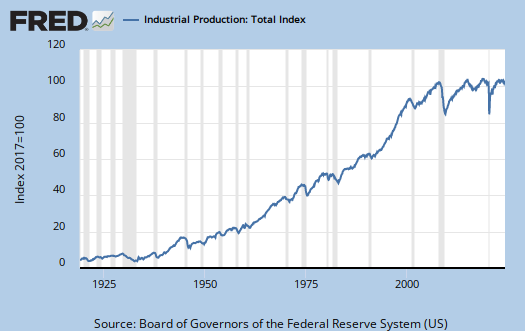
Industrial production increased 0.9 percent in January following a gain of 0.7 percent in December. Manufacturing production rose 1.0 percent in January, with increases for most of its major components, while the indexes for both utilities and mining advanced 0.7 percent. At 101.1 percent of its 2002 average, output in January was 0.9 percent above its year-earlier level. The capacity utilization rate for total industry rose 0.7 percentage point to 72.6 percent, a rate 8.0 percentage points below its average from 1972 to 2009.
Of the major groups, even construction had a positive gain of 1%, but down -5.3% for the year.
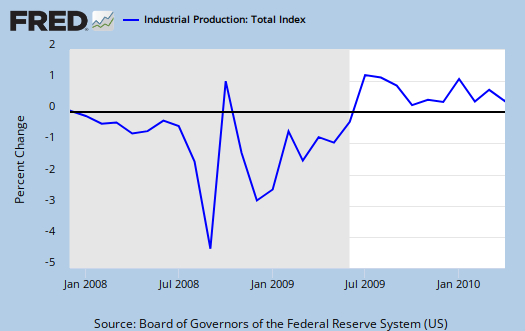
To put this is context, here is a graph of industrial production from right before the start of this recession.
The Industrial Production and Capacity Utilization for December 2009 was released last Friday, but it's significant and I want to cover it for completeness sake, even though this post is quite late.
Industrial Production has increased 0.8% from last month. Manufacturing increased 1.1% with gains in both durables and non-durable goods. This is good news. Mines (think about the price of commodities recently), increased 2.1% from last month. Utilities decreased -1.8%, blamed on mild temperatures.
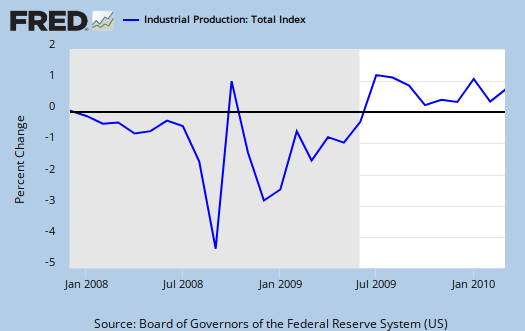
Here is the graph of industrial production since the official start of this recession, the index is now at 2002 levels:


Recent comments