
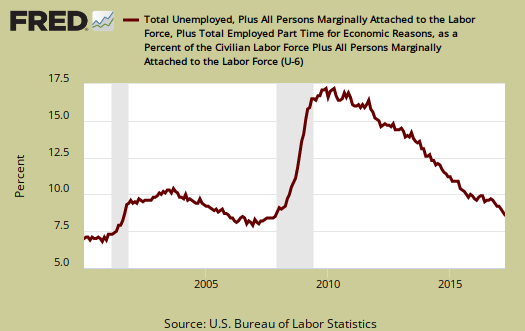
The April unemployment report on the surface looks really good because the unemployment rate is the lowest it has been since May 2007. Yet the cause of the low rate for the month is a mixed bag. Labor participation rates also remain low. On the other hand, an alternative measure of the unemployment rate, U-6, is the lowest it has been since November 2007. The question is more becoming why is the labor participation rate still low and what happened to those long term unemployed.

This article overviews and graphs the statistics from the Employment report Household Survey also known as CPS, or current population survey. The CPS survey tells us about people employed, not employed, looking for work and not counted at all. The household survey has large swings on a monthly basis as well as a large margin of sampling error. This part of the employment report is not about actual jobs gained, as reported by businesses, but people and their labor status.
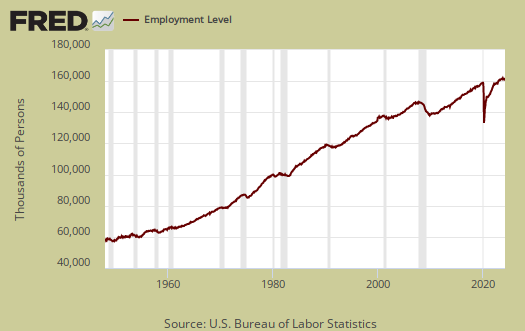
Those employed number 153,156,000, a 156,000 increase from the previous month. From a year ago, the ranks of the employed has increased by 2.128 million. Most of the annual gains have happened in the last three months. The annual gain is above what is required to keep up with new jobs for the increased population growth.
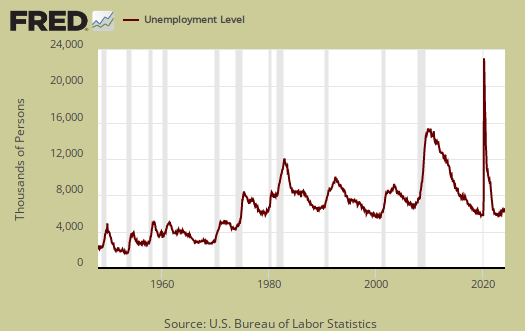
Those officially unemployed is 7,056,000, a -146,000 monthly drop. From a year ago the unemployed has decreased by −854,,000, which is quite a bit, 11%.
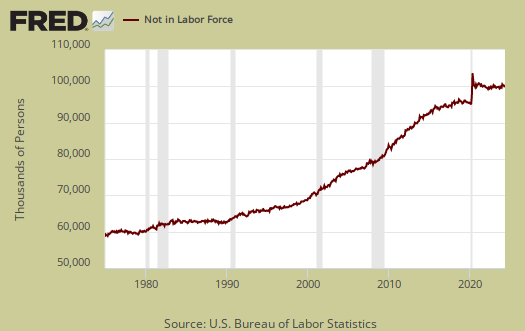
Those not in the labor force is 94,375 million. The below graph are the not in the labor force ranks. Those not in the labor force insignificantly gained by 162,000 for the month and from a year ago, a 344 thousand person increase. This is a huge levelling off of the constant growth in this figure and it is possible the jobs market has turned a corner and the growth is now really due to retiring baby boomers and increased full-time students.
The labor participation rate is 62.9%, which is consistently bad and this is a -0.1 percentage point change from last month. In April 2016, the labor participation rate was 62.8%, so not much change in a year. Pre-recession, the January 2008 labor participate rate was 66.2% and one must remember the job market was not good then.

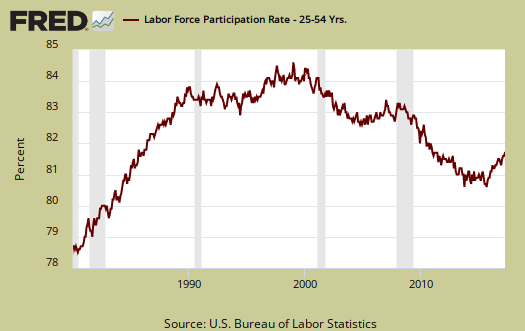
Below is a graph of the labor participation rate for those between the ages of 25 to 54. The rate is 81.7% and this is no change for the last three month. Ages 25-54 are the prime working years where people are not in retirement or in school full time as commonly as other age groups, so seeing this rate recover implies people really are getting jobs. In January 2008 the prime working years labor participate rate was 83.3%. We really should this age bracket labor participation rate go up if the job market is as red hot as the official unemployment rate implies.
The civilian labor force, which consists of the employed and the officially unemployed is 160,213,000. The civilian labor force has grown by 1,275,000 over the past year and by 12,000 or statistically no change, from last month. The BLS counts those on guest worker Visas and even illegal workers mixed in with permanent resident and citizen workers in their statistics.

Below is a graph of those not in the labor force, (maroon, scale on the left), against the noninstitutional civilian population (blue, scale on the right). Notice how those not in the labor force crosses the noninstitutional civilian population in growth. The civilian noninstituitonal population is from where all other labor statistics have sprung.

Below is a graph of the civilian labor force, or the official employed plus unemployed, in maroon, scale on left, against those not in the labor force, in blue, scale on right. See how those not in the labor force as a trend exceeded those considered employed and unemployed starting around mid 2009. Starting in 2014 it has reverted back, yet it oscillates starting in 2015. To have a solid employment situation those not in the labor force should be growing less than those obtaining jobs and being counted as looking for work. Those not in the labor force does include retirees and students and there is a baby boomer bump in both of these population groups.

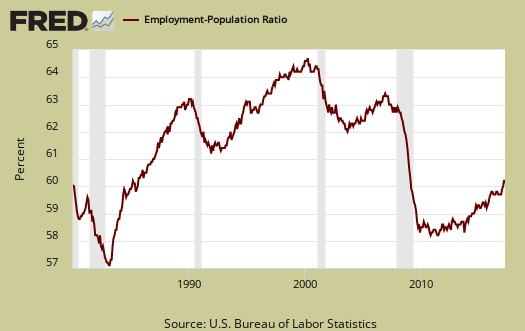
Those considered employed as a ratio to the total Civilian noninstitutional population is 60.2%, which is a 0.1 percentage point change from last month In April 2016 the employment to population ratio was 59.7%, so this is increasing. In January 2008, this figure was 62.9%. The relationship between the employment-population ratio and the labor participation rate (LPR) is: employment-population ratio = LPR * (1 - unemployment rate).
The number of people with part time work gives us some hints as to the kind of work being procured, since most career jobs are full time. Those forced into part time work for economic reasons stands at 5,272,000 people. This is a change of -281,000 from last month, a very large monthly decline. This is an annual decrease of -698 thousand.

There are two categories of those forced into part-time jobs due to economic circumstances. Those who could only get part-time jobs and those already working who got their hours cut due to businesses not having enough work for them. The number of people who could only get part-time jobs stands at 1,802,000 as shown below. This is a monthly decline of -50 thousand for the month. A year ago, the number of those stuck in part-time jobs was 1,993,000, so an annual decline of -191,000.

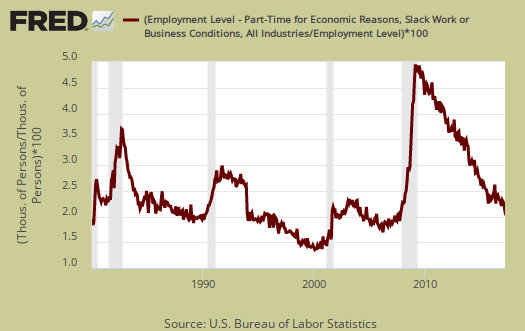
People can also work part-time hours due to slack business demand. People who got their hours cut due to slack working conditions stands at 3,174,000,a -228,000 monthly decline. Below is a graph of forced into part-time work because they got their hours cut, as a percentage of the total employed. This is a recession economic indicator as weak economic demand forces businesses to reduce the working hours of employees.
U-6, an alternative unemployment rate measure, stand at 8.6%, which is a -0.3 percentage point decline from last month. A year ago U-6 was 9.7%, so this is some significant movement. U-6 is a broader measure of unemployment and includes the official unemployed, people working part-time hours because that's all they can get and a subgroup not counted in the labor force but are available for work and looked in the last 12 months. The U-6 rate still leaves out some people wanting a job who are not considered part of the labor force, so while it is called an alternative rate, but it still ignores many who should be counted as unemployed.
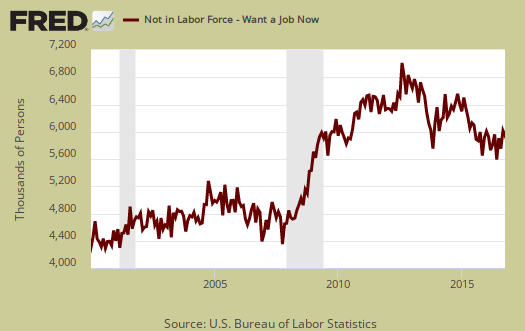
Within the CPS survey is how many people who are considered not in the labor force who report they want a job now. It is a direct survey question. The Census asks people who are not being counted in the unemployment statistics and official unemployment rate if they want a job. The number who answer yes currently stands at 5,707,000. Those not in the labor force who report they want a job has increased by 45 thousand from a year ago, which is a significant levelling out of growth. Time will tell is this holds or this group of people drops in number. For the month those not considered part of the labor force who said they wanted a job declined by -74 thousand.
April shows some much very good brighter statistics in the CPS versus the jobs report. Yet, the still low labor participation rate, in particular the age 25-54 group is disconcerting. It appears still there are hidden workers needing jobs who just are off the radar grid. Still the picture looks much brighter than even a year ago. Here are our past overviews CPS unemployment statistics, only graphs revised.
Recent comments