Like bonds, which move in ~60 year interest rate cycles (called the Kondratieff cycle), stocks also have very long, secular cycles that become apparent when we step back for the 30,000 foot view. For example, there was a long-term bull market from 1946-1966, followed by a long-term bear market from 1966-1982, followed by a long-term bull market from 1982-2000. Now we are in the midst of another long-term down cycle.
In this diary I will compare past long-term declines to estimate how steep a similar decline in the stock market and the economy is likely in this long-term bear market.
In strictly nominal terms, both the Dow Jones Industrial Average and the S & P 500 are down ~55%/65% from their all time highs. But that does not take inflation into account. To get an idea just how bad a real bear market can get, we need to look at inflation-adjusted, "real" returns. Below is a table of the worst bear markets, measured by the Dow Jones Industrial Average and the S&P 500 index, for the last 80 years, adjusted for inflation.
| High/subsequent low | % DJIA loss | % S&P 500 loss |
|---|---|---|
| 9/1929 | -------- | -------- |
| 7/1932 | (-86.2%) | (-80.6%) |
| 3/1938 | (-68.7%) | (-61.2%) |
| 4/1942 | (-73.8%) | (-72.5%) |
| 2/1966, 11/1968* | -------- | -------- |
| 12/1974 | (-64.2%) | (-57.8%) |
| 4/1980 | (-69.9%) | (-58.5%) |
| 8/1982 | (-74.4%) | (-60.0%) |
| 1/2000,3/2000* | ------- | ------- |
| 8/2002 | (-41.9%) | (-56.2%) |
| 3/2009 | (-56.2%) | (-64.7%) |
(*In both cases, the DJIA bottomed first, the S&P later. Inflation is measured separately from each top).
As you can see, measured by the S&P, we have already surpassed all of the 1970s inflationary bear markets, as well as the 1938 recession bear market. Only the Pearl Harbor WW2 market and the 1929-32 Depression are worse. Indeed, if I were a young investor, I would consider buying/adding to a S&P 500 index fund at this level (more on that in the next diary).
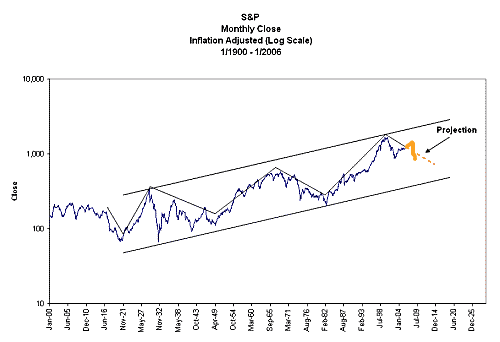
But noting how far equities have already fallen, doesn't give us a good reading on how much further they may yet fall. For that, I give you several long-term graphs, dating from 1900. Both are in log scale. First, the S&P 500:

(updated information in flesh-tone).
In order to fall to the bottom trendline in this graph, in 2009 the S&P would have to fall to ~450.
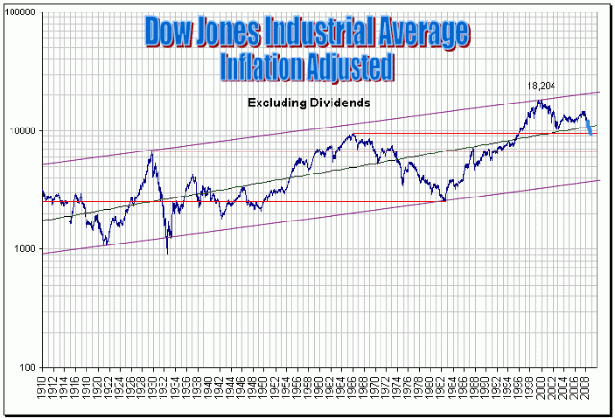
Next, the DJIA:

(updated information in light blue)
In order to fall to the bottom trendline in this graph, in 2009 the DJIA would have to fall to ~3000. Even now, in real terms, the DJIA has gained no ground whatsoever since its secular high of 1966!
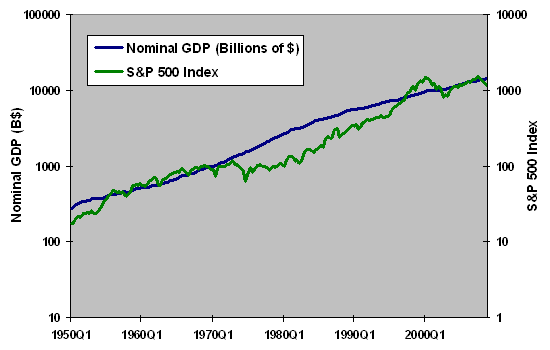
Keep in mind that, not surpisingly, over the long term, the stock market, being a forward looking estimate of corporate profits, closely tracks the growth in GDP. I don't have a chart going all the way back to 1900, but here is one from 1950:

The long term fluctuation around that trend can be seen as the psychologically recurring gradual waxing and waning of optimism and pessimism concerning the future of the US economy. In that regard, I have many times described us as being in a "Slow Motion Bust" that I expect will grind on for at least ~4 more years. By about that time I expect us to reach the bottom long term trend line, if not go below it. After all, the 20th century represented this nation reaching the zenith of its relative power; the 21st century is not likely to be so kind.
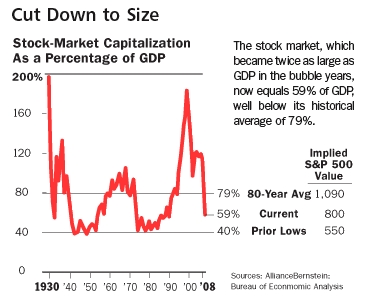
Thus, for another look at where the long term low is likely to be, here is a chart of stock valuations as a percentage of GDP from a couple of months ago:

Note that the S&P has already fallen further, from 800 to 670. But the GDP has also declined ~1.5% in the 4th quarter and is likely to decline similarly in this quarter. A 10% decline in GDP, for example, would put the bottom trendline of 40% of that amount at an S&P level of under 500.
Do I expect the stock market to reach the long-term lows I have discussed in this diary, and stay in that general range until about 2015-2020? Yes.
And I expect the general economy and the standard of living of Americans to fully reflect that decline.

Comments
The Great Decline
I'd like to see more on GDP vs. the stock market because due to the removal of traditional pensions, now retirement is based on this great gambling casino and it's probably the next great tsunami of poverty.
Then, I notice that the United States had a high quality of living even when the stock market wasn't the end all, be all.
So, how precisely did those traditional pensions get funded during those times?
The United States would not have to decline if they would start incubating select advanced manufacturing and start modifying trade agreements that are in the national interest.
It's like our "leaders" have been determined to wipe out the U.S. economically and I think they own dreams of riches beyond their belief is false. King Midas was duped in so many words.
you got your dead cat bounce today
The market is surging and they are saying it's Citigroups "Profit" (how can one have profit with billions in U.S. taxpayer money?)
and the reinstatement of the uptick rule to stop the shorts from ganging up on one particular stock.