
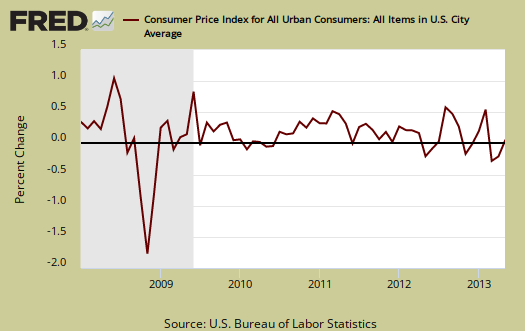
The May Consumer Price Index increased 0.1% from April. CPI measures inflation, or price increases. The culprit this time isn't gasoline, but shelter, which increased 0.3% for the month. This is the largest monthly increase in the shelter index since July 2011 and was responsible for half of the overall 0.1% inflation monthly increase. Take food and energy items out of the index and CPI actually rose 0.2% from April. Shelter is part of this figure.
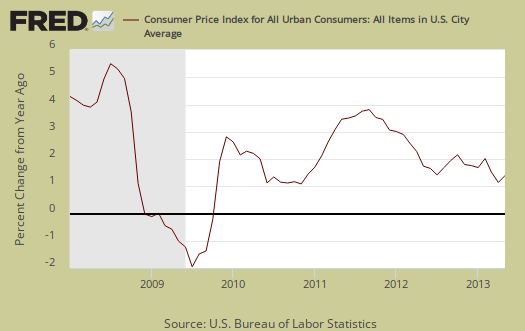
CPI is now up 1.4% from a year ago as shown in the below graph.
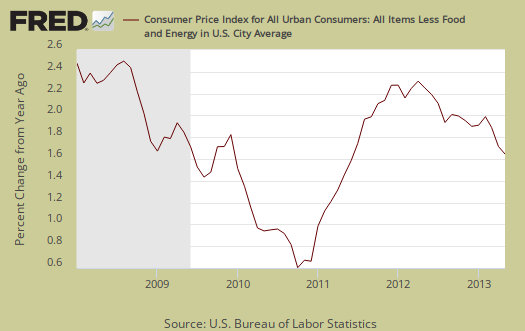
Core inflation, or CPI minus food and energy items, increased 0.2% for May. Core inflation has risen 1.7% for the last year, the same as last month and is the lowest annual increase since June 2011. Core CPI is one of the Federal Reserve inflation watch numbers and 2.0% is their boundary figure. Those wanting the Fed to continue their quantitative easing will be pleased with these low annual inflation figures. Graphed below is the core inflation change from a year ago.
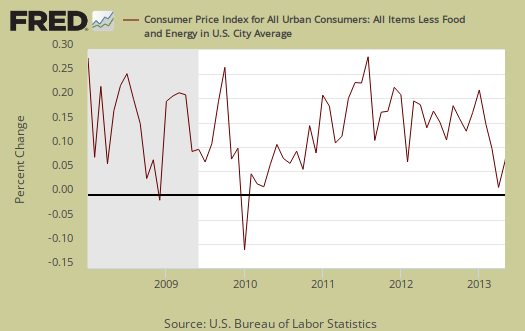
Core CPI's monthly percentage change is graphed below. The ten year average for core inflation has been a 1.9% annual increase.
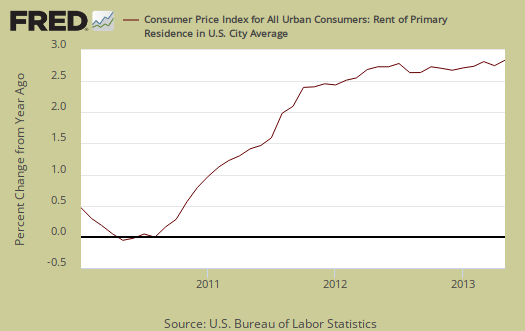
Core inflation's components include shelter, transportation, medical care and anything not food or energy. Shelter increased 0.3% and is up 2.3% for the year. The shelter index is comprised of rent, the equivalent cost of owning a home, hotels and motels. Rent increased 0.3% for the month, while the equivalent of owning a home increased 0.2%. Lodging away from home, which has much less weight in the shelter index, increased 1.2% for the month. Welcome summer vacationers! Airfares jumped 2.2%. New cars and trucks prices had no change for the month and used autos declined by -0.1%. Clothing increased as apparel prices rose 0.2%. Many indexes saw no change, but transportation services increased 0.4% for the month. Graphed below is rent, where cost increases hits people who can least afford it most.
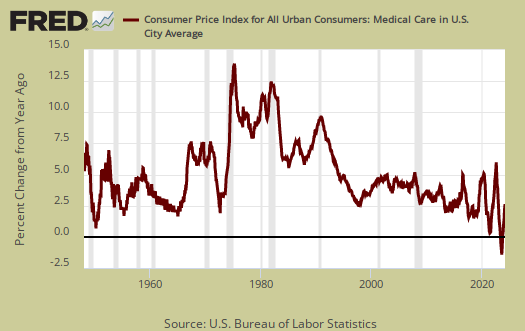
A core inflation cost which almost never drops is medical care, yet this month is different. Medical care decreased -0.1% and for two months in a row we have seen a decrease in prices. Hallelujah. The last time the Medical care index didn't increase was July 2010, The Medical care index has increased 2.2% over the last 12 months. This is the lowest annual increase since 1972. Nowhere else do we see a ridiculous, constant increase in costs every single month, so to see the medical care index decreasing is like a miracle occurred. Graphed below is the overall medical care index change from a year ago.
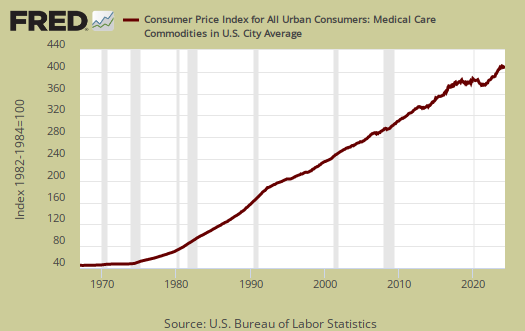
The reason for this month's decline is a -0.6% drop in prescription drug prices. Below is a graph of the medical commodities index, which in large part consists of prescription drug prices and overall declined -0.5% for this month. Notice the beyond belief never ending increases since 1975, yet starting around 2013, we see a drop. Has something broken the stranglehold of big pharma on the United States? We don't think so, yet any declines are welcome news, especially for our baby boomers heading into their golden years.
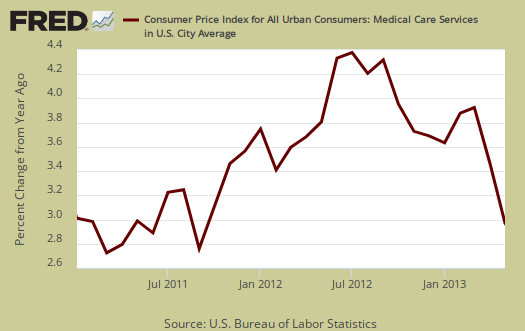
Medical services prices were unchanged. You'll never see the below graph of Medical care services change from a year ago go below zero, unlike other item prices.
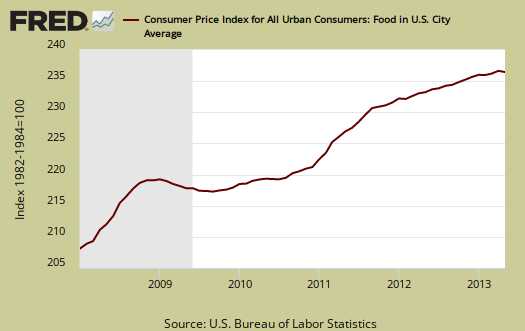
Food and beverages overall decreased -0.1% and have increased 1.5% from a year ago. The food at home index (think groceries) declined -0.3% for the month and had the largest monthly decline since July 2009. Food for home is now only up 0.8% for the year. Eating out, or food away from home increased 0.2% from last month and is up 2.3% from a year ago. Graphed below is the overall food index.
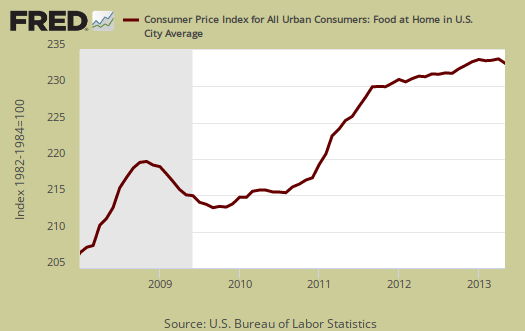
Below is the food at home index. While the biggest decline since July 2009 is welcome news, we can see this is really a drop in the bucket on increasing grocery costs. The only index of the six which increased was fruits and vegetables, a 0.4% monthly increase. From the BLS:
Four of the six major grocery store food group indexes posted declines, led by nonalcoholic beverages, which fell 1.1 percent. The index for dairy and related products decreased 0.8 percent, its third decline inthe last four months. The indexes for cereals and bakery products and other food at home both turned down in May, falling 0.4 percent and 0.3 percent, respectively. The index for meats, poultry, fish, and eggs, which increased in April, was unchanged in May.
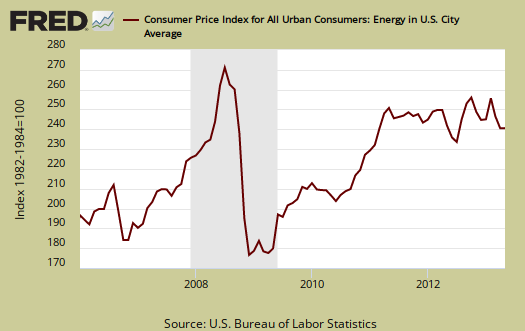
Energy overall increased 0.4% for May, and energy costs are now down -1.0% for the entire year. Last month the energy index declined by -4.3%. The BLS separates out all energy costs and puts them together into one index and this one includes gasoline which was unchanged for the month. Energy commodities decreased by -0.1%. Fuel oil plunged -2.9%, natural gas increased 2.4% and electricity increased 0.4% for the month. Natural gas is now up 14.2% from a year ago. Energy costs are also mixed in with other indexes, such as heating oil for the housing index and gas for the transportation index. Below is the overall CPI energy index, or all things energy.
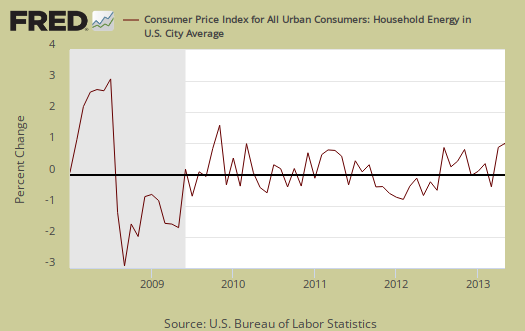
Graphed below is the household energy index which includes electricity and natural gas, shown by monthly percentage change. This month the index increased 0.9%. From this time last year household energy has increased 3.7%. This is a different, special index to show the overall costs for energy into your home only. Household energy represents about 4.1% of month assumed expenditures, yet for the poor or those on fixed incomes, we suggest this is a critical inflation measure, to heat or cool one's home.
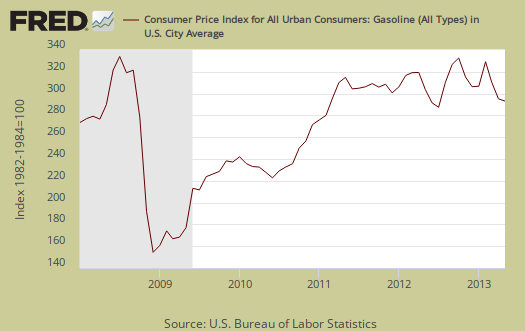
Graphed below is the CPI gasoline index only, which shows the volatility of gas prices. The gasoline index is down -4.1% from a year ago.
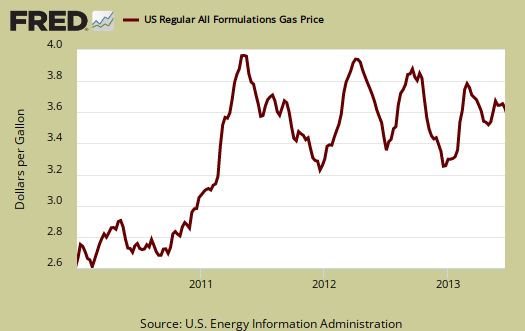
Below are gas prices, last updated June 17th, where gas was $3.626/gal., although you couldn't get that if you lived in the Northwest, where consumers repeatedly get gouged for a period. From the below graph, we can assume gasoline won't be that much in flux for June's inflation numbers.
According to the BLS, for the year, food and beverages, which includes food at home, made up 15.3% of the index. Housing is 41% and transportation, including gas for the car, is 16.9% and all energy is 9.5%. Medical care is only 7.2%, they claim, which goes to show what averages can remove. Most people are not sick and why the average costs are so low. A Medical event can bankrupt a family, with insurance.
CPI-W is used to calculate government transfer payments, such as social security increases. For April, CPI-W increased 0.2%, and not seasonally adjusted for the year has increased 1.2%.
CPI details
The DOL/BLS does take yearly surveys on where the money goes in the monthly budget, but as one can see, food and energy are significant amounts of the monthly finances. Run away costs in these two areas can break the bank, so can food. Additionally CPI uses substitution, so if steak goes through the roof, somehow we're all just fine with hamburger and prices didn't really overall increase much.
Other CPI report overviews, unrevised, although most graphs are updated, are here. If you're wondering why the graphs look weird, the graph calculates percentages from the index and doesn't round. The actual data from the BLS report does round to one decimal place. In other words, 0.05% is rounded to 0.1%.
Recent comments