
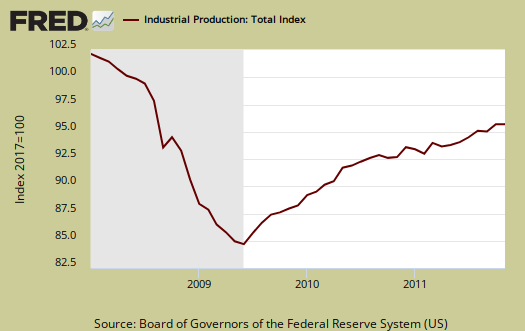
The Federal Reserve's Industrial Production & Capacity Utilization report shows a -0.2% decrease for November 2011 Industrial Production. This report is also known as output for factories and mines. Manufacturing alone dropped -0.4%. October's industrial production stayed the same +0.7%.
While many in the press are screaming this is the first percentage drop in 7 months, which is true, let's just put that percentage change in perspective with the below monthly industrial production monthly percentage change graph.
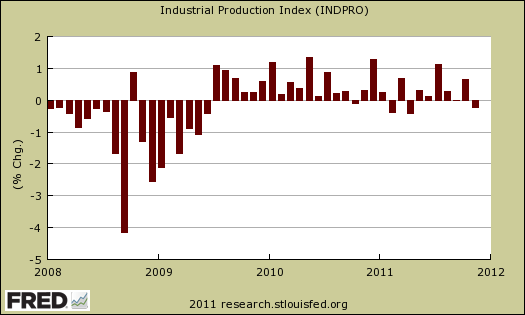
Utilities increased +0.2% in November. Mining industrial production increased +0.1%. The report big bomb is the auto industry. Auto & parts manufacturing cliff dove -3.4% in a month. Autos alone dropped -5.5%. Without the auto factory output disaster, manufacturing decreased -0.2%.
While various economists blame overseas suppliers for the decline in autos, in particular Thailand flowing, bear in mind the South Korean trade agreement is kicking in, where there is consensus more auto manufacturing will be offshore outsourced and a flood of Korean autos will come roaring into the United States. We also had China slap an outrageous tariff on the few autos still manufactured in the United States, SUVs. It might be the auto industry saw that tariff coming, even though most of us did not. Finally, even when a car is assembled in the United States and thus counted as U.S. manufacturing output, parts, engines are globally sourced. Japan has a Tsunami and Earthquake, Thailand floods out, these events can bottle neck the entire global supply chain and can cause a sudden cliff dive in U.S. manufacturing. Many U.S. manufacturers now rely on a global supply chain that is subject to natural and man made disasters.
Total Industrial production is still down -5.2% from pre-recession levels, in other words going on 4 years, even while up +3.7% from November 2010. The Fed also reports capacity utilization, is -2.6 percentage points below the entire 1972-2010 average, but is up 2.0 percentage points from a year earlier.
Here are the major industry groups yearly industrial production percentage changes from a year ago.
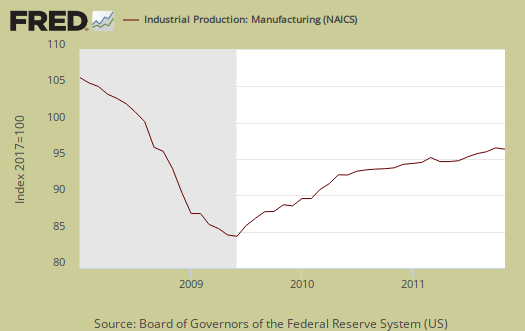
- Manufacturing: +3.8%
- Mining: +6.7%
- Utilities: -0.7%
Below is the Fed's description of Market groups from the report and their monthly percent changes.
The output of consumer goods declined 0.5 percent in November. The production of durable consumer goods fell 1.4 percent, as the indexes for automotive products and home electronics dropped 2.0 percent or more. The output of appliances, furniture, and carpeting decreased 0.2 percent, while the output of miscellaneous goods increased 0.6 percent. The production of nondurable consumer goods moved down 0.2 percent; an increase of 1.0 percent for consumer energy products was outweighed by a decrease of 0.7 percent for other nondurable consumer goods. The decline in non-energy nondurables reflected reduced output for each of its major categories.
In November, the index for business equipment edged down 0.1 percent; during the previous four months, the index had advanced, on average, more than 1.0 percent per month. The output of transit equipment was unchanged in November, as gains in the output of civilian aircraft and railroad equipment offset declines in the production of motor vehicles for businesses. Overall, the index for transit equipment remained more than 25 percent above its year-earlier level. The index for information processing equipment inched up 0.1 percent in November, and the production of industrial and other equipment decreased 0.3 percent.
The production of defense and space equipment climbed 1.4 percent in November after a similarly sized gain in October.
The output of construction supplies rose 0.4 percent in November, its third consecutive monthly increase. The index for business supplies fell 1.1 percent, with lower production in both its energy and non-energy components.
The index for materials to be further processed in the industrial sector was unchanged in November. The output of durable materials gained 0.4 percent for a second straight month and was up 5.9 percent from a year earlier. In November, among the major categories of durable materials, consumer parts moved down 0.2 percent, equipment parts were unchanged, and other durable materials advanced 0.7 percent. The production of nondurable materials decreased 0.5 percent; a gain in paper materials was outweighed by losses in both textile and chemical materials. The output of energy materials was unchanged.
Below is the industrial production graph for construction, in black, where we can see this entire sector is still decimated after the housing bubble burst. Construction supplies increased 0.4% this month and are up 3.7% since November 2010.

Business supplies, on the other hand, dropped -1.1% and is only up 0.8% for the year.
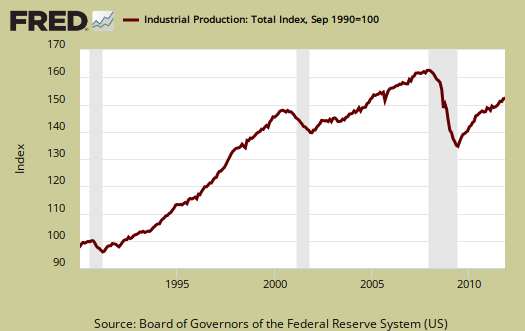
Below is another graph of industrial production since September 1990, indexed to that month. Look at the slope, the growth through the 1990's and then compare to 2000 decade. It was in 2000 when the China trade agreement kicked in and labor arbitrage of engineers, advanced R&D, I.T., STEM started in earnest.
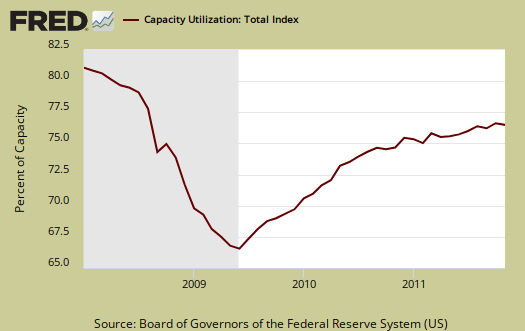
Another bomb in this report is capacity. Capacity utilization, or of raw capacity, how much is being used, for total industry is now 77.8%, down 0.2 percentage points from last month. This is -2.6 percentage points below the average from 1972 to 2010, 80.4%. Capacity utilization has increased 2.0 percentage points from November 2010.
By NAICS codes Durable manufacturing dropped -0.2 percentage points with Motor vehicles and parts dropping an astounding 2.5 percentage points in capacity utilization. Another bomb is the capacity utilization rate for electronics equipment, appliances and components which dropped 1.2 percentage points.
Below are capacity utilization's monthly percentage point change. Notice the second consecutive large percentage point change drop for high tech.
- manufacturing: -0.3
- mining: 0.0
- utilities: +0.1
- selected high-technology industries: -1.6
- crude: -0.4
- primary: 0.0
- finished: -0.4
Capacity utilization is how much can we make vs. how much are we currently using. The U.S. is still not producing what it is capable of, a reflection of the output gap. Note, this index is normalized to a specific year, currently from most reports, the 2007 yearly average (see year in the graph). Therefore, one cannot take absolute values of capacity utilization, i.e. 80%, and claim this is an indicator of a healthy economy, for it all depends on what year capacity utilization is normalized to. One can take the slope, or rate of change from the peak of a recession and determine recovery, but again, these percentages are relative, they are not absolute ratios to a static point in time. Utilization is a percentage of real total capacity.
According to the report, manufacturing uses 77.8% of capacity, utilities 10.4% and mining 11.8%.
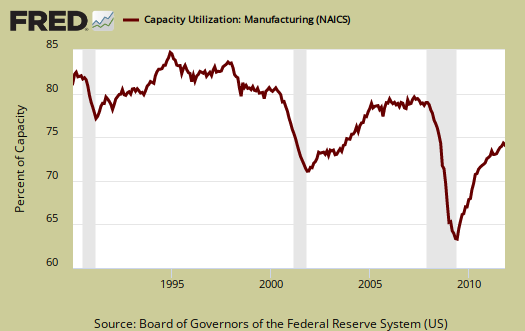
Below is the Manufacturing capacity utilization graph, normalized to 2007 raw capacity levels, going back to the 1990's. Too often the focus is on the monthly percent change, so it's important to compare capacity utilization to pre-recession levels and also when the economy was more humming.
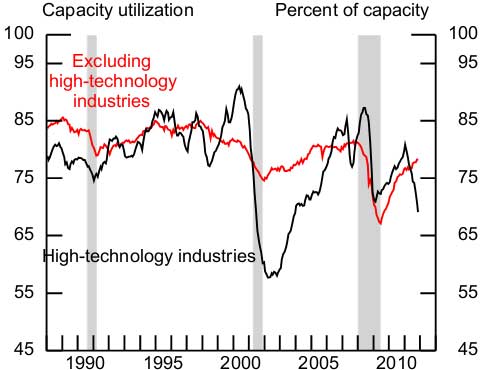
One of the more interesting graphs is high technology capacity utilization, shown below. These high tech sectors seems to correlate to when the high tech industry offshore outsourced in droves to China and communications equipment is one area that is being offshore outsourced.. High Technologies capacity utilization keeps dropping and this month was another -1.6 percentage point change.
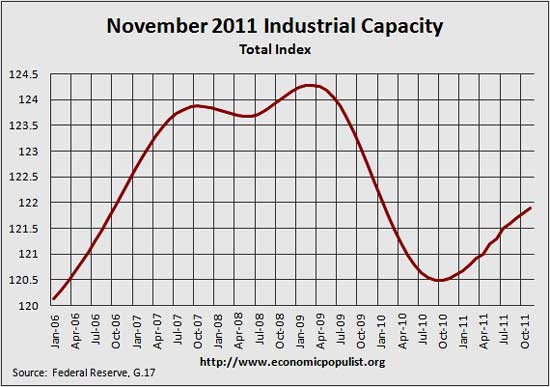
Below is the graph of raw capacity, indexed against 2007 output. This is just how much capacity does the U.S. have to make stuff. Look at how total capacity declined, for the first time in the historical data, during the recession. This index represents the raw facilities, potential to make stuff. Raw capacity is the underlying number by which utilization is calculated. This month capacity increased +0.1 and capacity growth is 1.1% for the year. We are back on the rise, but still below pre-recession levels.
If you are baffled by what crude, finished mean, read these stages of production definitions.
The Federal Reserve releases detailed tables for more data, metrics not mentioned in this overview.
Here is our industrial production report overview from last month, unrevised.
Recent comments