
The March Consumer Price Index dropped by -0.3%. That's unusual and a decline in CPI has not happened since February 2016. The reason was volatile gas prices but America finally is catching a break on cell phone service costs too. The gasoline index by itself dropped -6.2% for the month. The bigger surprise is Inflation without food and energy prices considered dropped by -0.1%. That hasn't happened since 2010.

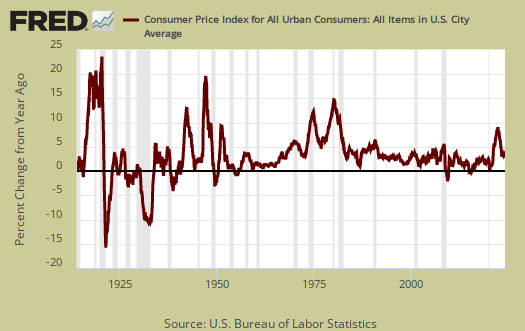
Yearly overall inflation was 2.4%, much less than last month's 2.7% increase, and is shown in the below graph.
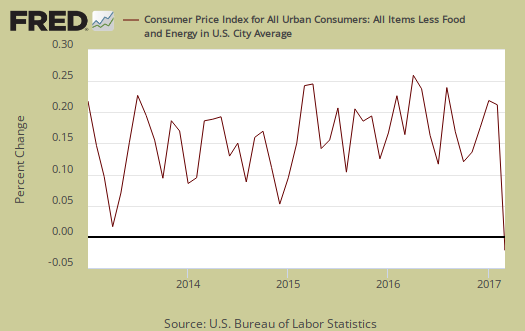
Core inflation, or CPI with all food and energy items removed from the index, has increased 2.0% for the last year. and this is the smallest annual amount since November 2015. For the past decade the annualized inflation rate has been 1.9%. Core inflation is the figure the Federal Reserve considers for interest rate increase decisions.

Core CPI's monthly -0.1% percentage change is graphed below. Within core inflation, shelter increased 0.1%, which is actually less of a jump than typical and the lowest increase since June 2014. Did people get a break on buying a home or rent? Of course not, rent increased 0.3%, whereas hotels and motels went down -2.8%. and home ownership equivalent rent increased 0.2%. Shelter overall is up 3.5% for the year with rent increasing 3.9% annually. Wireless service dropped a whooping -7.0% for the month and is down -11.4% for the year. New cars decreased by -0.3% and used cars and trucks decreased by -0.9%. Apparel decreased -0.7% for the month, but this was after a 0.6% February rise. Car insurance increased 8.1% for the year, the largest jump since June 2003.
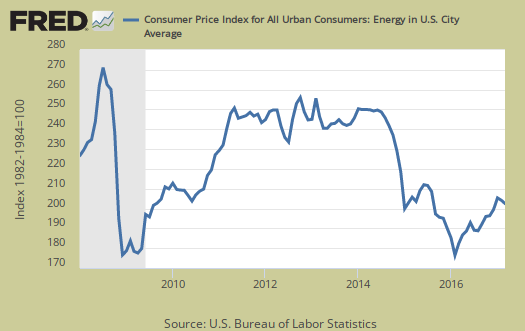
The energy index decreased -3.2% for the month and is now up 10.9% from a year ago. The BLS separates out all energy costs and puts them together into one index. For the year, gasoline has now increased 19.9%. Fuel oil is up 24.9% for the year, while dropped by -0.8% this month. Natural gas dropped by -0.8% but is up 10.3% for the year while electricity is down -0.1% for the month and has increased 1.6% for the year. Graphed below is the overall CPI energy index.
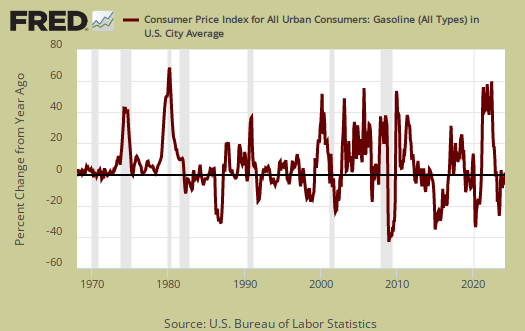
Graphed below is the CPI gasoline index annual percentage change and for the month gas dropped by -6.2%.
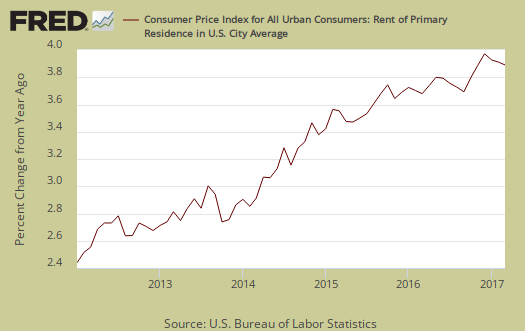
Graphed below is the rent price index which has been soaring for some time, now up 3.9% annually, and is shown in the below graph.
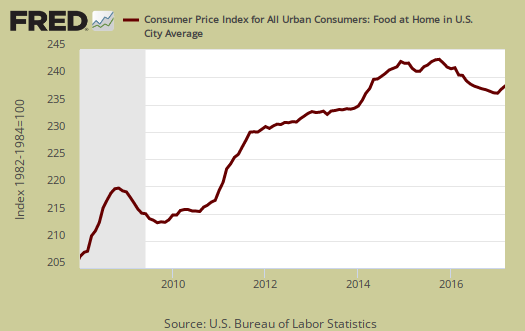
Food prices increased by 0.3% for the month. Food and beverages have now changed 0.5% from a year ago. Groceries, (called food at home by the BLS), increased 0.5% for the month but are still down -0.9% for the year. Fresh fruit rose 2.4% for the month and four of the six major grocerty store food group indexes increased. Dairy and related products decreased by -0.6% for the month after gaining for three months prior. Eating out, or food away from home increased 0.2% for the month and is up 2.4% for the year.

Graphed below are grocery prices, also referred to as the food at home index.
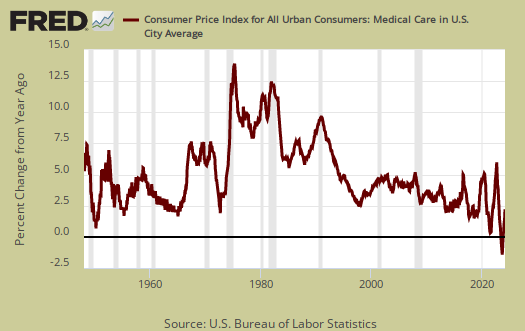
Medical costs are part of core inflation and are a never ending source of price increases. The Medical care index increased 0.1% for the month. Prescription drugs was unchanged but hospital services increased by 0.4%. Physicians services dropped by -0.3% for the month. Graphed below is the overall medical care index, which is up 3.5% from a year ago.
Below is a graph of the medical commodities index, which is mostly prescription drug prices and is up by 0.2 % for the month, 3.9% for the year.

Real hourly earnings increased by 0.5% for all employees. Real means wages adjusted for inflation. CPI dropped by -0.3% while hourly wages increased by 0.2%. For the year real hourly earnings have increased 0.3%. The average real hourly wage is now $10.72 and the average wage, not adjusted for inflation is $26.14. Weekly real earnings increased by 0.5% as hours worked did not change and weekly earnings increased by 0.2%. Real weekly earnings now stand at $367.83. The work week is 34.3 hours. There is a separate category for production and nonsupervisory employees, which means worker bees and their real hourly earnings increased by 0.5% to $9.22 and their real weekly earnings increased 0.3% to $308.72. Their weekly hours dropped by -0.3% to 33.5 hours. For the year production and nonsupervisory employees hourly earnings have had no change and weekly earnings are down -0.3%.
CPI details
The DOL/BLS does take yearly surveys on where the money goes in the monthly budget, but as one can see, food and energy are significant amounts of the monthly finances. Run away costs in these two areas can break the bank, so can food. Additionally CPI uses substitution, so if flour goes through the roof, somehow we're all just fine with oats and prices didn't really overall increase much. Here is the BLS CPI site, where one can find much more details, information on calculation methods and error margins.
Other CPI report overviews, unrevised, although most graphs are updated, are here. If you're wondering why the graphs display different figures from the text, the graphs calculate percentages from the index and do not round. The actual data from the BLS report does round to one decimal place. In other words, 0.05% is rounded to 0.1%.
Recent comments