
The November 2012 ISM Manufacturing Survey PMI decreased, -2.2 percentage points, to 49.5% and and is now in contraction. This is the 4th time in six months manufacturing PMI has contracted. PMI hasn't been this low since July 2009's 49.2% PMI and the employment index contracted to September 2009 levels. There is a survey reported slowdown in demand for manufacturers who are also clearly disgusted by Congress and the fiscal cliff. Superstorm Sandy is barely mentioned.

New Orders plunged by -3.9 percentage points, to 50.3%. New Orders inflection point, where expansion turns into contraction, isn't exactly 50% for the long term, it is 52.3%. This implies while the monthly new orders is growing, the long term is not. From the ISM:
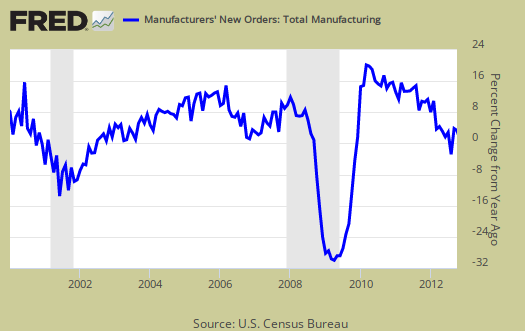
A New Orders Index above 52.3 percent, over time, is generally consistent with an increase in the Census Bureau's series on manufacturing orders.

The Census reported manufactured durable goods new orders as no growth in October where factory orders, or all of manufacturing data, will be out December 5th. The ISM claims the Census and their survey are consistent with each other. To wit, below is a graph of manufacturing new orders percent change from one year ago (blue, scale on right), against ISM's manufacturing new orders index (maroon, scale on left) to the last release data available for the Census manufacturing statistics. Here we do see a consistent pattern between the two.
The ISM gives a descending ordered list of industry sectors whose new orders increased and this month there are only five sectors which showed increases.
The five industries reporting growth in new orders in October are: Furniture & Related Products; Food, Beverage & Tobacco Products; Paper Products; Computer & Electronic Products; and Miscellaneous Manufacturing. The eight industries reporting a decrease in new orders during October — listed in order — are: Primary Metals; Wood Products; Machinery; Electrical Equipment, Appliances & Components; Transportation Equipment; Chemical Products; Nonmetallic Mineral Products; and Apparel, Leather & Allied Products.
Below is the ISM table data, reprinted, for a quick view.
| Manufacturing at a Glance November 2012 | ||||||
|---|---|---|---|---|---|---|
| Index | Nov. | Oct. | % Point Chg. | Direction | Rate | Trend |
| PMI | 49.5 | 51.7 | -2.2 | Contracting | From Growing | 1 |
| New Orders | 50.3 | 54.2 | -3.9 | Growing | Slower | 3 |
| Production | 53.7 | 52.4 | +1.3 | Growing | Faster | 2 |
| Employment | 48.4 | 52.1 | -3.7 | Contracting | From Growing | 1 |
| Supplier Deliveries | 50.3 | 49.6 | +0.7 | Slowing | From Faster | 1 |
| Inventories | 45.0 | 50.0 | -5.0 | Contracting | From Unchanged | 1 |
| Customers' Inventories | 42.5 | 49.0 | -6.5 | Too Low | Faster | 12 |
| Prices | 52.5 | 55.0 | -2.5 | Increasing | Slower | 4 |
| Backlog of Orders | 41.0 | 41.5 | -0.5 | Contracting | Faster | 8 |
| Exports | 47.0 | 48.0 | -1.0 | Contracting | Faster | 6 |
| Imports | 48.0 | 47.5 | +0.5 | Contracting | Slower | 4 |
| OVERALL ECONOMY | Growing | Slower | 42 | |||
| Manufacturing Sector | Contracting | From Growing | 1 | |||
Production, which is the current we're makin' stuff now meter, increased 1.3 percentage points from last month to 53.7% and is in expansion. Production usually follows incoming orders so this is no surprise as reflected by October's new orders increase.

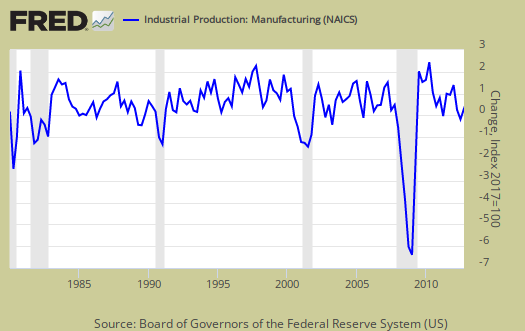
ISM's manufacturing production index loosely correlates to the Federal Reserve's industrial production, but not at 50% as the inflection point, instead 51.2% to indicate growth. Below is a graph of the ISM manufacturing production index (left, maroon), centered around the inflection point, quarterly average, against the Fed's manufacturing industrial production index's quarterly change (scale right, blue). We can see there is a matching pattern to the two different reports on manufacturing production.
The manufacturing ISM employment index cliff dove -3.7 percentage points to 48.4%. The neutral point for hiring vs. firing is 50.1% and employed just significantly contracted for the 1st time in 37 months. Employment is a lagging indicator additionally. Below is the ordered list of employment increases to cuts.
Of the 18 manufacturing industries, seven reported growth in employment in November in the following order: Textile Mills; Paper Products; Petroleum & Coal Products; Primary Metals; Furniture & Related Products; Food, Beverage & Tobacco Products; and Machinery. The 10 industries reporting a decrease in employment in November — listed in order — are: Wood Products; Plastics & Rubber Products; Apparel, Leather & Allied Products; Electrical Equipment, Appliances & Components; Miscellaneous Manufacturing; Computer & Electronic Products; Fabricated Metal Products; Transportation Equipment; Chemical Products; and Printing & Related Support Activities.
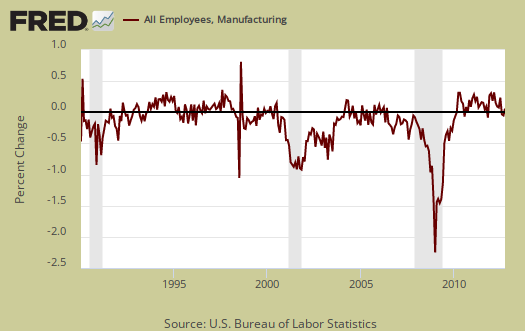
Below are the BLS manufacturing non-farm payrolls (jobs) for the past decade on the left (maroon), graphed against the ISM manufacturing employment index on the right (blue). The BLS manufacturing payrolls is the monthly percentage change and the ISM manufacturing employment index is centered around it's inflection point of contraction and employment growth. This is just monthly change, manufacturing has lost approximately 6 million jobs over the graphed time period.
Inventories plunged a full -5.0 percentage points to 45.0%, which is is not a good sign and in contraction. The ISM claims inventories are correlated to manufacturing inputs, that are part of GDP. Changes in nonfarm inventories, of which manufacturing is only a part, added 1.16 percentage points to Q3 2012's 2.7% GDP.
An Inventories Index greater than 42.8 percent, over time, is generally consistent with expansion in the Bureau of Economic Analysis' (BEA) figures on overall manufacturing inventories.

Supplier deliveries are how fast manufacturers can get their supplies. A value higher than 50 indicates slower delivery times, a value below 50 means the supply chain is speeding up. The index increased 0.7 percentage points to 50.3% and are slowing. We suspect this month's slowing is associated with Hurricane Sandy.

Backlog of orders decreased another -0.5 percentage points to 41.0%. Order backlogs are still in contraction, now for eight consecutive months. More order backlogs would imply production and thus hiring might be stepped up. Order backlogs are exactly what they sound like and only 86% of survey respondents reported on order backlogs.

Imports increased 0.5 percent points to 48.0% and are in contraction. Imports are materials from other countries manufacturers use to make their products.

New orders destined for export, or for customers outside of the United States, decreased another -1.0 percentage point to 47.0% and is in contraction, the 6th month in a row. The exports index is now lower than June 2009's 49.5%.

The ISM price index decreased -2.5 percentage points to 52.5%. Prices are what manufacturers pay to make their products and this month means prices are increasing, but at a slower rate than October. In April 2009 the price subindex was 32%.

Customer's inventories plunged -6.5 percentage points to 42.5%. Below 50 means customer's inventories are considered by manufacturers to be too low. Customer inventories, not to be confused with manufacturer's inventories, are how much customers have on hand, and rates the level of inventories the organization's customers have. It appears businesses are cutting inventories dramatically.

Comments from ISM survey respondents sound frustrated. Almost all mention weak demand and many discuss the fiscal cliff and policy implications keeping manufacturers from expanding in such uncertainty. Only one mentioned Superstorm Sandy as delaying shipments.
Here is the ISM industrial sector ordered list of growth and contraction. Printing may very well be subject to a technological shift.
Of the 18 manufacturing industries, six are reporting growth in November in the following order: Petroleum & Coal Products; Paper Products; Furniture & Related Products; Electrical Equipment, Appliances & Components; Food, Beverage & Tobacco Products; and Computer & Electronic Products. The 11 industries reporting contraction in November — listed in order — are: Apparel, Leather & Allied Products; Wood Products; Primary Metals; Transportation Equipment; Chemical Products; Fabricated Metal Products; Miscellaneous Manufacturing; Nonmetallic Mineral Products; Plastics & Rubber Products; Machinery; and Printing & Related Support Activities.
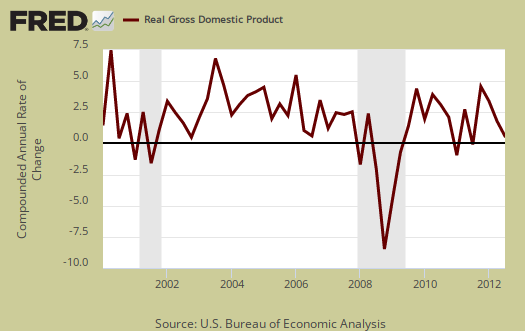
The ISM has a correlation formula to annualized real GDP, but they are now noting the past correlation. Notice also that the PMI went to equal weighting in 2008. November's data, the ISM get a 2.3% 2012 annual real GDP. The below graph plots real GDP, left scale, against PMI, right scale, GDP up to Q3 2012. One needs to look at the pattern of the two lines to get anything out of this by quarters graph. If they match, GDP goes up, PMI goes up, would imply some correlation. ISM claims the January to November PMI indicates a 3.1% annual real GDP.
The ISM neutral point is 50, generally. Above is growth, below is contraction, There is some some variance in the individual indexes and their actual inflection points. For example, A manufacturing PMI above 42, over time, also indicates growth, even while manufacturing is in the dumpster.
Here is last month's manufacturing ISM overview, unrevised.
The ISM has much more data, tables, graphs and analysis on their website. For more graphs like the above, see St. Louis Federal Reserve Fred database and graphing system.
PMI™ stands for purchasing manager's index.
On ISM correlations to other indexes, when in dollars they normalized to 2000 values. The above graphs do not do that, so our graphs are much more rough than what the ISM reports these indices track.
Recent comments