
The September 2012 ISM Manufacturing Survey PMI increased, 1.9 percentage points, to 51.5% and moved into expansion. This is welcome news for the ISM manufacturing survey showed contraction for the previous three months. One of the survey respondents called the previous manufacturing slowdown a summer thing, let's hope they are right.

New Orders increased 5.2 percentage points, to 52.3%. New Orders inflection point, where expansion turns into contraction, is not 50%, it is 52.3%, so we're right on the cusp. From the ISM:
A New Orders Index above 52.3 percent, over time, is generally consistent with an increase in the Census Bureau's series on manufacturing orders.

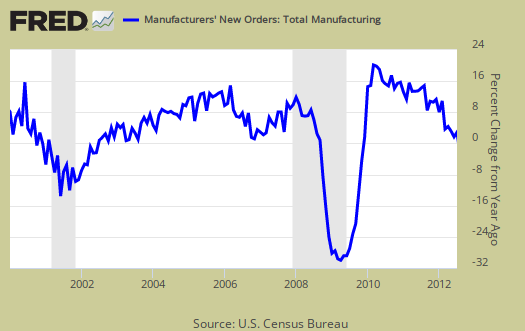
The Census reported manufactured durable goods new orders plunged -13.2% in August where factory orders, or all of manufacturing data, will be out October 4th. The ISM claims the Census and their survey are consistent with each other. To wit, below is a graph of manufacturing new orders percent change from one year ago (blue, scale on right), against ISM's manufacturing new orders index (maroon, scale on left) to the last release data available for the Census manufacturing statistics, July. Here we do see a consistent pattern between the two.
The ISM gives a descending ordered list of industry sectors whose new orders increased. As we can see, it's nondurable goods at the top, petroleum and coal, who has the largest increase. Notice the contraction list is primarily durable goods manufacturing.
The eight industries reporting growth in new orders in September — listed in order — are: Petroleum & Coal Products; Apparel, Leather & Allied Products; Food, Beverage & Tobacco Products; Furniture & Related Products; Paper Products; Plastics & Rubber Products; Primary Metals; and Fabricated Metal Products.
The six industries reporting a decrease in new orders during September — listed in order — are: Nonmetallic Mineral Products; Electrical Equipment, Appliances & Components; Transportation Equipment; Machinery; Miscellaneous Manufacturing; and Wood Products.
PMI is a composite index on manufacturing. Here's how the ISM defines PMI:
The PMI is a composite index based on the seasonally adjusted diffusion indexes for five of the indicators with equal weights: New Orders, Production, Employment, Supplier Deliveries and Inventories.
Below is the ISM table data, reprinted, for a quick view.
| Manufacturing at a Glance September 2012 | ||||||
|---|---|---|---|---|---|---|
| Index | Sept. | August | % Point Chg. | Direction | Rate | Trend |
| PMI | 51.5 | 49.6 | +1.9 | Growing | From Contracting | 1 |
| New Orders | 52.3 | 47.1 | +5.2 | Growing | From Contracting | 1 |
| Production | 49.5 | 47.2 | +2.3 | Contracting | Slower | 2 |
| Employment | 54.7 | 51.6 | +3.1 | Growing | Faster | 36 |
| Supplier Deliveries | 50.3 | 49.3 | +1.0 | Slowing | From Faster | 1 |
| Inventories | 50.5 | 53.0 | -2.5 | Growing | Slower | 2 |
| Customers' Inventories | 49.5 | 49.0 | +0.5 | Too Low | Slower | 10 |
| Prices | 58.0 | 54.0 | +4.0 | Increasing | Faster | 2 |
| Backlog of Orders | 44.0 | 42.5 | +1.5 | Contracting | Slower | 6 |
| Exports | 48.5 | 47.0 | +1.5 | Contracting | Slower | 4 |
| Imports | 49.5 | 49.0 | +0.5 | Contracting | Slower | 2 |
| OVERALL ECONOMY | Growing | Faster | 40 | |||
| Manufacturing Sector | Growing | From Contracting | 1 | |||
Production, which is the current we're makin' stuff now meter, increased 2.3 percentage points from last month to 49.5%, which is still contraction.

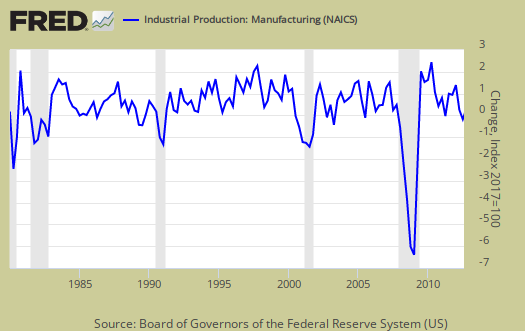
ISM's manufacturing production index loosely correlates to the Federal Reserve's industrial production, but not at 50% as the inflection point, instead 51.2% to indicate growth. Below is a graph of the ISM manufacturing production index (left, maroon), centered around the inflection point, quarterly average, against the Fed's manufacturing industrial production index's quarterly change (scale right, blue). We can see there is a matching pattern to the two different reports on manufacturing production.
The manufacturing ISM employment index popped up 3.1 percentage points to 54.7%. The neutral point for hiring vs. firing is 50.1%. Employment is a lagging indicator and the sector reporting the largest increase in jobs was Textile Mills.
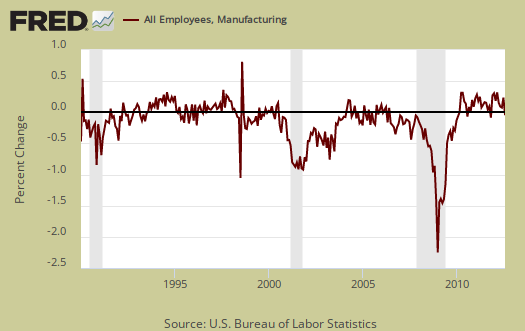
Below are the BLS manufacturing non-farm payrolls (jobs) for the past decade on the left (maroon), graphed against the ISM manufacturing employment index on the right (blue). The BLS manufacturing payrolls is the monthly percentage change and the ISM manufacturing employment index is centered around it's inflection point of contraction and employment growth. This is just monthly change, manufacturing has lost approximately 6 million jobs over the graphed time period.
Inventories declined -2.5 percentage points to 50.5%, which is still growing, but slower. The ISM claims inventories are correlated to manufacturing inputs, that are part of GDP. Changes in business inventories, of which manufacturing is only a part, subtracted –0.29 percentage points to Q2 2012's 1.25% GDP.
An Inventories Index greater than 42.8 percent, over time, is generally consistent with expansion in the Bureau of Economic Analysis' (BEA) figures on overall manufacturing inventories.

Supplier deliveries are how fast manufacturers can get their supplies. A value higher than 50 indicates slower delivery times, a value below 50 means the supply chain is speeding up. The index increased +1.0 percentage points to 50.3% and the ISM reports this it the 1st month supplier deliveries are slowing.

Backlog of orders increased +1.5 percentage points to 44.0%. While still in contraction for the 6th month in a row, the improvement is better news. More order backlogs implies production and thus hiring might be stepped up. Order backlogs are exactly what they sound like and only 86% of survey respondents reported on order backlogs. Petroleum & Coal were the biggest sector for increased order backlogs.

Imports increased 0.5 percent points to 49.5%, but is still contraction. Imports are materials from other countries manufacturers use to make their products.

New orders destined for export, or for customers outside of the United States, increased +1.5 percentage point to 48.5% and is in contraction, the 4th month in a row. The exports index is now the same as June 2009's 49.5%.

The ISM price index increased another 4.0 percentage points to 58.0%, the 2nd month in an increase trend. Prices are what manufacturers pay to make their products. In April 2009 the price subindex was 32%.

Customer's inventories increased +0.5 percentage points to 49.5%. Below 50 means customer's inventories are considered by manufacturers to be too low. Customer inventories, not to be confused with manufacturer's inventories, are how much customers have on hand, and rates the level of inventories the organization's customers have. An increase might indicate weak demand.

Some comments from ISM survey respondents were more perky, yet others warned of more slowing. Two which stood are out are this one from Computer & Electronic Products:
We are sticking to our manufacturing plan, but have slowed production down considerably. Haven't added any new units to the 2012 plan, and still have no forecast for 2013 released.
...and this comment from Chemical Products:
Demand seems to have stabilized from August. New orders are appearing this month without advanced notice from our customers
One survey respondent blamed Obamacare for low sales, which is almost amusing, laughable.
Here is the ISM industrial sector ordered list of growth and contraction:
Of the 18 manufacturing industries, 11 are reporting growth in September in the following order: Textile Mills; Food, Beverage & Tobacco Products; Printing & Related Support Activities; Wood Products; Apparel, Leather & Allied Products; Paper Products; Petroleum & Coal Products; Primary Metals; Fabricated Metal Products; Furniture & Related Products; and Miscellaneous Manufacturing. The six industries reporting contraction in September — listed in order — are: Nonmetallic Mineral Products; Electrical Equipment, Appliances & Components; Transportation Equipment; Machinery; Chemical Products; and Computer & Electronic Products.
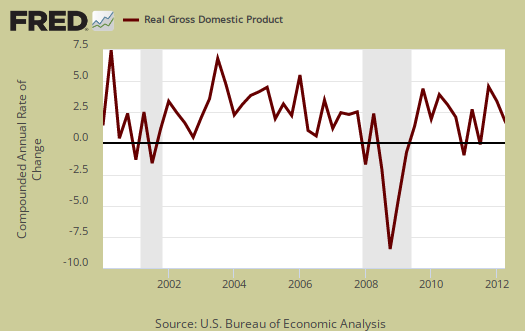
The ISM has a correlation formula to annualized real GDP, but they are now noting the past correlation. Notice also that the PMI went to equal weighting in 2008. Annualizing September's data, the ISM get a 3.0% 2012 annual real GDP. The below graph plots real GDP, left scale, against PMI, right scale, GDP up to Q2 2012. One needs to look at the pattern of the two lines to get anything out of this by quarters graph. If they match, GDP goes up, PMI goes up, would imply some correlation. ISM claims the January to September PMI indicates a 3.2% annual GDP.
The ISM neutral point is 50, generally. Above is growth, below is contraction, There is some some variance in the individual indexes and their actual inflection points. For example, A manufacturing PMI above 42, over time, also indicates growth, even while manufacturing is in the dumpster.
Here is last month's manufacturing ISM overview, unrevised.
The ISM has much more data, tables, graphs and analysis on their website. For more graphs like the above, see St. Louis Federal Reserve Fred database and graphing system.
PMI™ stands for purchasing manager's index.
Skeptics abound on this month's manufacturing PMI
Boy oh howdy. Anyone notice when a statistic comes out that doesn't match the "expected number" put up on so many press sites' economic calenders all hell breaks loose?
Right now we have all sorts of "analysis" popping up trying to imply this report is wrong. It's not wrong and hey, 51.5% isn't that great in the first place folks. New orders is NOT prices, it's volume, there's one mistake out there in analysis. Second, this is all of manufacturing, hello, oil & gas refining are part of manufacturing by this report. Regionals will NOT match since some regions are more durable goods, others nondurable and so on.
The key statistics to validate the ISM are the October 4th manufacturing report, released by the Census and the Federal Reserve industrial production report. We'll try to turn to this article on October 4th and update the corresponding graph.
We also edited this overview to include a graph of the Fed G.17 manufacturing industrial production against the ISM manufacturing production index.