
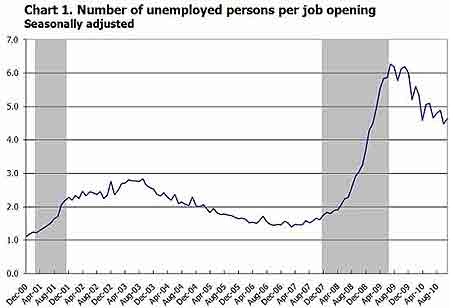
JOLTS stands for Job Openings and Labor Turnover Survey. The November report shows there were 4.63 official unemployed people hunting for a job to every position available. If one takes the official broader definition of unemployment, or U6, the ratio becomes even worse, 8.17.
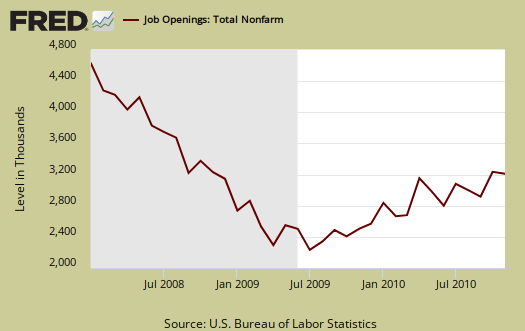
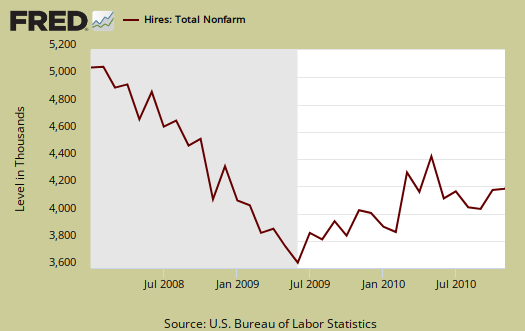
There were 3.2 million job openings on the last business day of November, the U.S. Bureau of Labor Statistics reported today. The job openings rate was essentially unchanged over the month at 2.4 percent. Both the hires rate and the separations rate were little changed at 3.2 percent each in November.
Bear in mind this is only the official 15.04 million November unemployed, it's not counting the disappeared unemployed as well as the forced part-time, temporary.
Additionally, this ratio is worse than October, where the ratio of official unemployed to jobs openings was 4.4.
We can see some of this in the actual hires from November, totaling 4.21 million. This is incredibly low and flat.
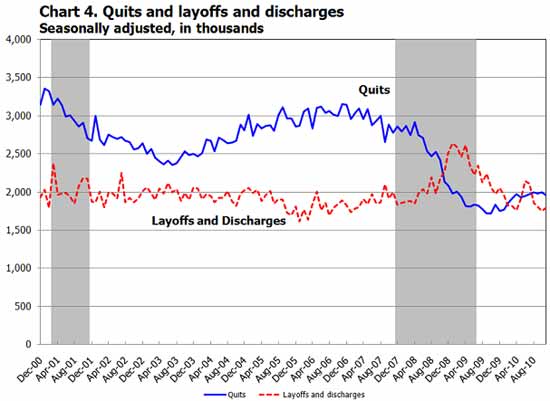
Below are total job separations, 4,118,000, with the term separation meaning you're out of a job through a layoff, quitting or retirement. Notice how separations is almost equal to the number of hires. Seems the revolving door has come to working America, although not quite the same as the one in Washington D.C.
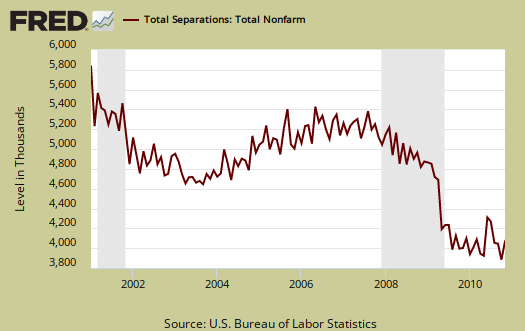
The number of quits or voluntary job separations is becoming dangerously close to the number of fires. Want a choice of employers? Doesn't seem to be much of an option today.
In November 2010, the proportion of quits for total nonfarm was 47 percent and the proportion of layoffs and discharges was 43 percent. For total private, the proportions were 48 percent quits and 43 percent layoffs and discharges. For government, the proportions were 34 percent quits and 44 percent layoffs and discharges.
The JOLTS takes a random sampling of 16,000 businesses and derives their numbers from that. The survey also uses the CES, or current employment statistics, not the household survey as their base benchmark. These means all of those people not counted as needing a job are also not in the baseline of this survey.
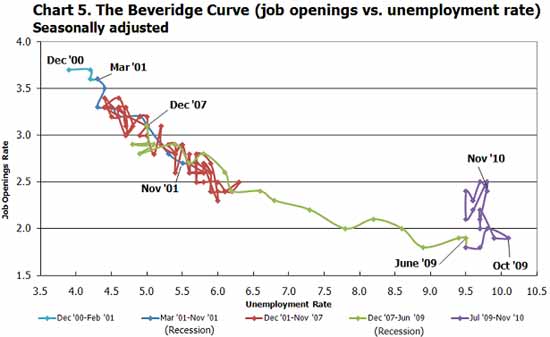
The BLS was kind enough to make a credible Beveridge Curve graph, reprinted below. The Beveridge curve shows the official unemployment rate vs. the job openings rate. If you see a bunch of data points to the far right, that's bad, it means there is long term unemployment and not enough jobs. Look at how we're stuck to the right.
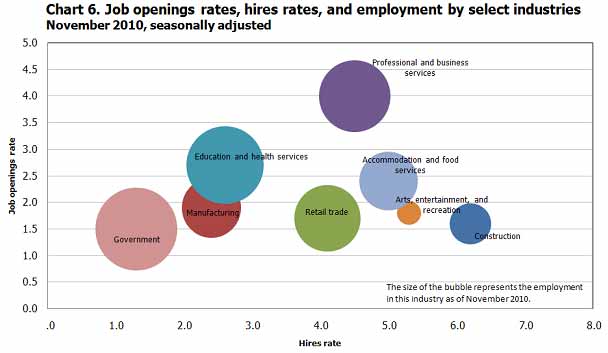
For the JOLTS report, the BLS creates some fairly useful graphs, some of which were reprinted here, and they have oodles of additional information in their databases, broken down by occupational area. Below is a reprint of their bubble graph, and the first thing to note is how health and educational employment dwarfs manufacturing. That's really not good for economics of scale.
To put these ratios into perspective, there were 4.8 million job openings in March 2007 and believe this or not, the low point of job openings was in July 2009, where the number has increased 39%, obviously not enough.
Here is our October's JOLTS report overview.
EPI reports 4.6 and differences between this overview on JOLTS
EPI ran similar calculations I think this morning (here), even though their post date is also yesterday, which didn't match mine.
I figured out these are round off errors and what is included or not in the calculations.
I went back and modified to two decimal places to make the two overviews rectified, I suspect it is only EPI and then this site bothering to calculate out some ratios in the first place. Also, EPI's their broader calculation is not U-6, but they make their assumptions.
Also, the JOLTS is a sample and so on, so take these ratios as plain being bad and if one wants to get technical on how many decimal places are really valid, it's probably 0 due to round-off, sampling error and revision data.
I wish those guys at EPI would put up even all of their assumptions but they do not.