
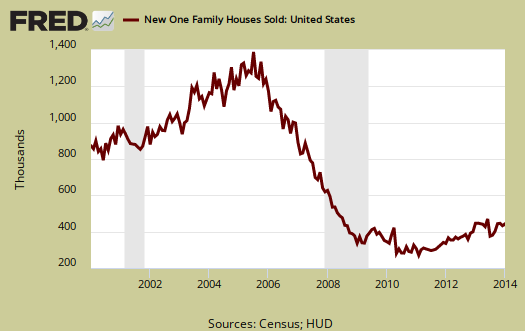
January 2014 New Residential Single Family Home Sales increased 9.6% to 468,000 in annualized sales. This change is well within the statistical error margin of ±17.9%. This is the highest level of new home sales since July 2008. New single family home sales are now just 2.2% above January 2013 levels, but this figure has a ±20.2% margin of error. A year ago new home annualized sales were 458,000. Sales figures are annualized and represent what the yearly volume would be if just that month's rate were applied to the entire year. These figures are seasonally adjusted as well. Beware of taking these monthly percentage changes in new home sales to heart, for most months the change in sales is inside the statistical margin of error and will be revised significantly in the upcoming months. This month's increase especially is suspect for other housing indicators show declines.
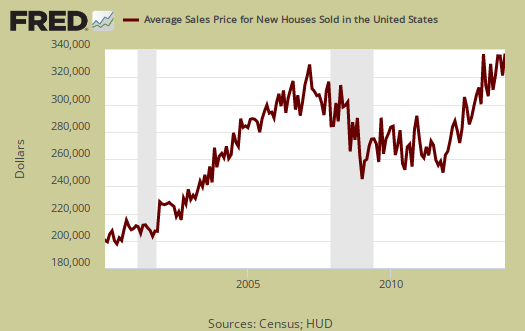
To see an affordability problem, just look at new home prices now. The average home sale price was $322,800, a 5.2% increase from a year ago. These prices are still clearly outside the range of what most wages can afford.
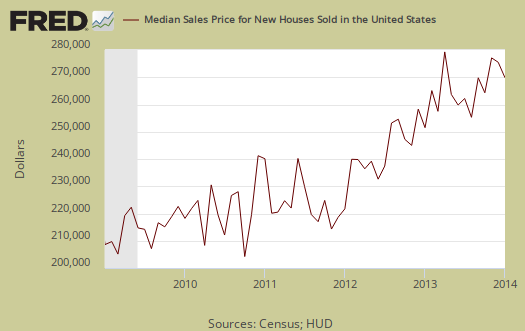
January's median new home price was $260,100. From January 2013, the median new home sales price has increased by 3.4%. Median means half of new homes were sold below this price and both the average and median sales price for single family homes is not seasonally adjusted.
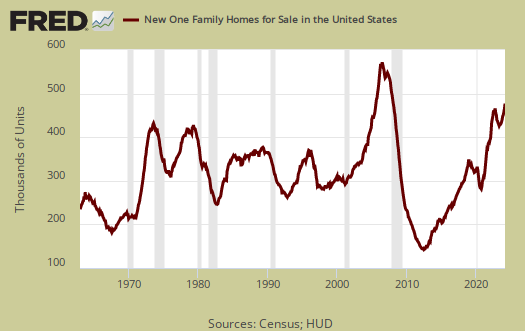
Inventories: New homes available for sale had no change from last month to 184,000 units. This is a 23.5% increase from a year ago.
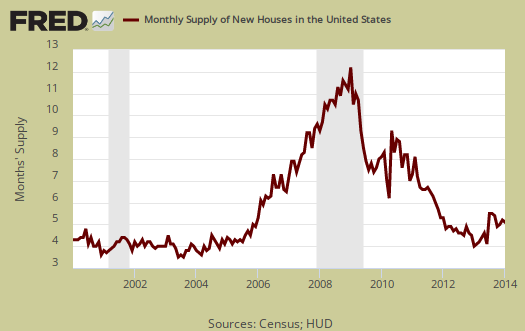
Below is a graph of the months it would take to sell the new homes on the market at each month's sales rate, currently at 4.7 months We can see these inventories vs. sales times have plunged. The supply of new homes at current sales rates declined -9.6% from December but is up 20.5% from a year ago.
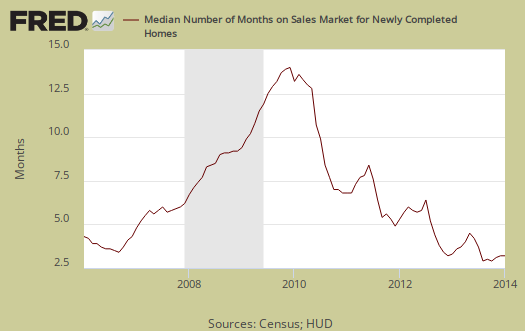
The median time a house was completed and on the market for sale to the time it sold was 3.3 months. This is unchanged from a year ago.
The variance in monthly housing sales statistics is so large, in part, due to the actual low volume overall, along with the fact this is a survey. One needs to look at least a quarter to get a real feel for new home sales, but a year of sales data is more in order. Additionally this report, due to it's huge margin of error, is almost always revised significantly the next month. Buyer beware on month to month comparisons and reacting to primarily figures and why we graph up the statistics so one can identify a real trend versus press headline buzz. This is also why we produce so many graphs, one needs to see the overall trend, not focus on just monthly headline buzz percentage change figures.
What we know for certain about new homes sales is the change from a year ago seems to be leveling off. New single family home prices are really out of reach for most families by median income in this country. In spite of this month's increase, it appears the residential real estate market is leveling off. Without funky finance, aka subprime returning, we just don't see where home sales can go. By traditional finance, the prices and mortgage rates along with credit requirements appear out of reach for most first time home buyers.
The Census notes that the average revision is about 5% of the original reported. Here are our overviews of residential real estate statistics, only some graphs revised.
Recent comments