
The September unemployment report is really a disaster. Yet another 579,000 people dropped out of the labor force. The labor participation rate dropped to record lows not seen since October 1977. That's 38 years ago. Even more disturbing is how the unemployment rate is really undermined as a reading on the state of labor. The official unemployment rate did not change at all and remained at 5.1%. The worst aspect is these statistics appear to be a trend, not a monthly anomaly. Will this situation ever end and America really get back on it's labor force feet?

This article overviews and graphs the statistics from the Employment report Household Survey also known as CPS, or current population survey. The CPS survey tells us about people employed, not employed, looking for work and not counted at all. The household survey has large swings on a monthly basis as well as a large margin of sampling error. This part of the employment report is not about actual jobs gained but people and their labor status.
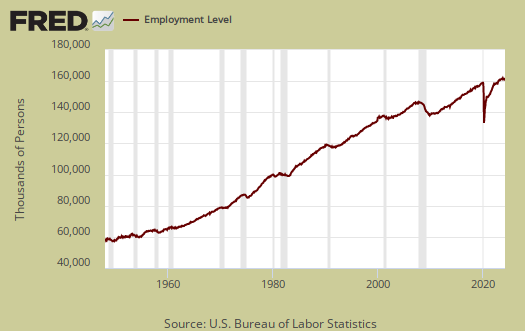
Those employed dropped by -236,000 this month. From a year ago, the ranks of the employed has increased by 2.193 million, but that annual gain is much less than it was a month ago.
Those unemployed decreased by -114,000 to stand at 7,915,000. From a year ago the unemployed has decreased by -1.322 million. Below is the month change in unemployed and as we can see, this number typically has wild swings from month to month.

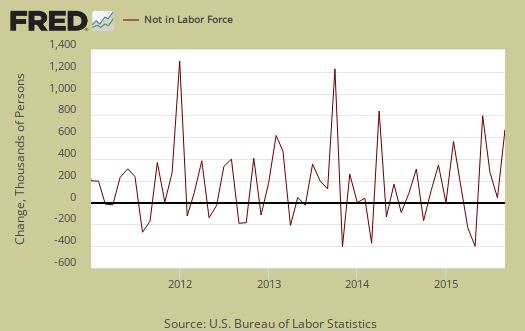
Those not in the labor force increased by 569,000 to 94.61 million. The below graph is the monthly change of the not in the labor force ranks. Those not in the labor force has increased by over 2 million in the past year. That's faster growth than the drop in those unemployed and almost equal to the annual gains in those obtaining work.
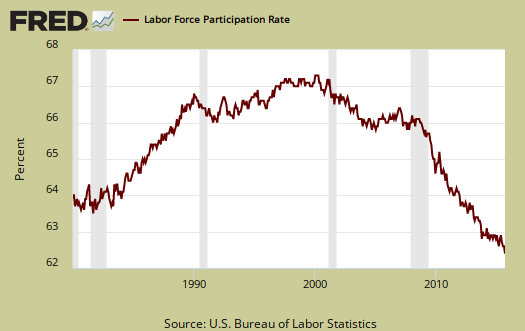
The labor participation rate dropped by -0.2 percentage points to 62.4%, a low not seen since October 1977. This is astounding even when taking into consideration the increasing retirement age population.
Below is a graph of the labor participation rate for those between the ages of 25 to 54. The rate is 80.6%, which is a -0.1 change from last month and a rate not seen since April 1984, (discounting times past the great recession when the American work experience collapsed). This proves labor participation rate cannot be explained away by retiring baby boomers and continuing education past high school full time as these are prime working years for people.

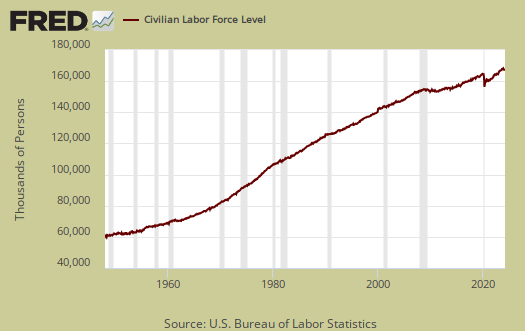
The civilian labor force, which consists of the employed and the officially unemployed, declined by -350 thousand this month. The civilian labor force has grown by 870,000 over the past year. New workers enter the labor force every day from increased population inside the United States and immigration, both legal and illegal. The small annual figure also implies people are dropping out of the labor force. Notice how those not in the labor force has grown 231% bigger than the civilian labor force.
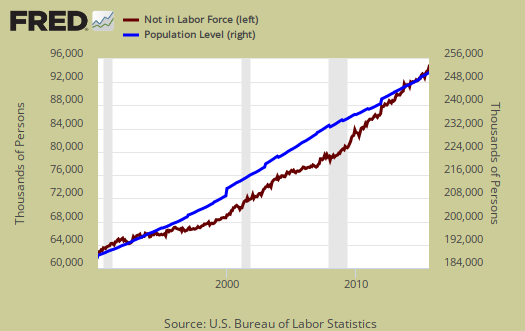
Those not in the labor force often grows faster than the population which has the potential to work recently. Below is a graph of those not in the labor force, (maroon, scale on the left), against the noninstitutional civilian population (blue, scale on the right). Notice how those not in the labor force crosses the noninstitutional civilian population in growth and the accelerated growth started happening right in 2008. The increase cannot be explained by retiring baby boomers alone and notice the recent uptick.
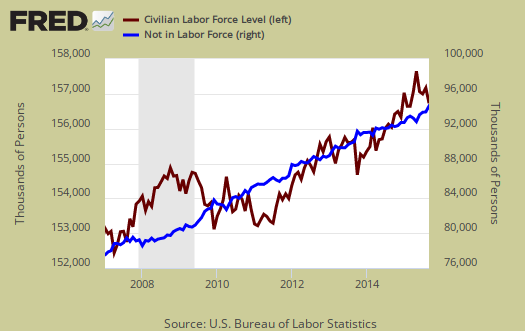
Below is a graph of the civilian labor force, or the official employed plus unemployed, in maroon, scale on left, against those not in the labor force, in blue, scale on right. See how those not in the labor force as a trend exceeded those considered employed and unemployed starting around mid 2009. Starting in 2014 it has reverted back, yet look at how is it reverted once again! The never ending growing segment of the population that is considered neither employed or unemployed, was above the trend line of those who would be naturally dropping out, such as the retired and those in school. This shows those not in the labor force was growing much faster than those obtaining jobs and being counted as looking for work. Not in the labor force figures do include retirees and the size of the population greater than age 65 has grown.
Those considered employed as a ratio to the total Civilian noninstitutional population now stands at 59.2%, a -0.2 percentage point change from last month. The relationship between the employment-population ratio and the labor participation rate (LPR) is: employment-population ratio = LPR * (1 - unemployment rate).

A better sign is those forced into part-time work due to the economy plunged by -448 thousand for the month. This monthly change hasn't been so great since January 2014. Those forced into part time work for economic reasons stands at 6,036,000 people. There are still millions of people who need full-time jobs with benefits who simply can't get them. The annual decrease is now -1.02 million.

There are two categories of those forced into part-time jobs due to economic circumstances. Those who could only get part-time jobs and those already working who got their hours cut due to businesses not having enough work for them. The number of people who could only get part-time work decreased by -108,000 as shown below.
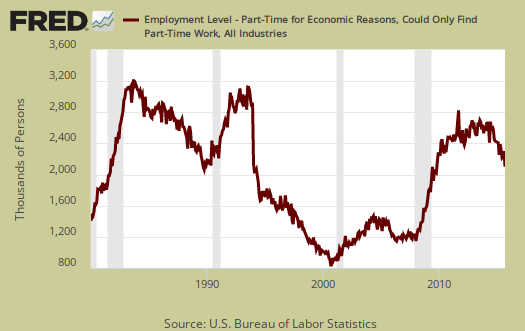
People can also work part-time hours due to slack business demand. People who got their hours cut due to slack working conditions decreased by -272,000 and stands at 3,569,000. Below is a graph of forced into part-time work because they got their hours cut, as a percentage of the total employed. This is a recession economic indicator and this figure just is still elevated, yet this month's plunge is one of the silver linings of this report.

Part-time workers who are voluntarily working part-time jobs increased by 211,000 to stand at 19,971,000. That just seems incredible to have almost 20 million people voluntarily working part-time.

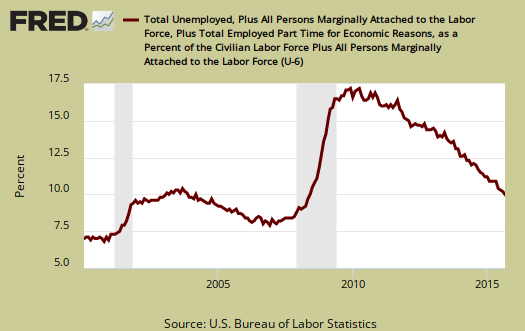
U-6 now stands at 10.0% a -0.3 percentage point decrease. U-6 is a broader measure of unemployment and includes the official unemployed, people working part-time hours because that's all they can get and a subgroup not counted in the labor force but are available for work and looked in the last 12 months. The U-6 rate still leaves out some people wanting a job who are not considered part of the labor force, so while it is called an alternative rate, but it still ignores those long term hopeless and desperate. This drop is due to the part-timer plunge.
The newly unemployed really searched this month by 268.000 to 2,363,000. Below is a graph of those unemployed for less than five weeks.

The long term unemployed, or those unemployed for 27 weeks and over, -83 dropped by thousand to 2,104,000 people. From a year ago the long term unemployed ranks has declined by 847,000. This decline without a corresponding bump up in employed also implies many long term unemployed are simply dropped from the labor force.

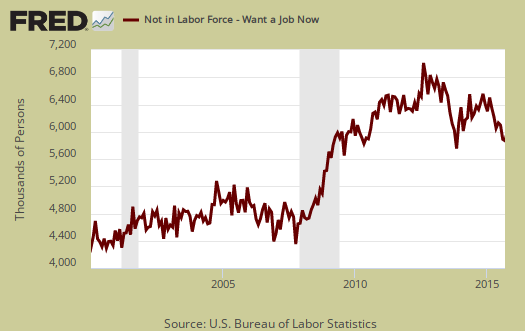
Within the CPS survey is how many people who are considered not in the labor force who report they want a job now. It is a direct survey question. The Census asks people who are not being counted in the unemployment statistics and official unemployment rate if they want a job. The number who answer yes currently stands at 5,955,000, and increased by 23 thousand from last month. Those who are not counted yet report they want a job includes the discouraged workers and marginally attached and is seasonally adjusted. This figure has decreased by 430 thousand from a year ago.
The average length of unemployment is 26.3 weeks and a year ago was 31.8 weeks. This is a 5.5 week drop from a year ago The average time to be unemployed is still completely out of line with the median due to the long term unemployed.
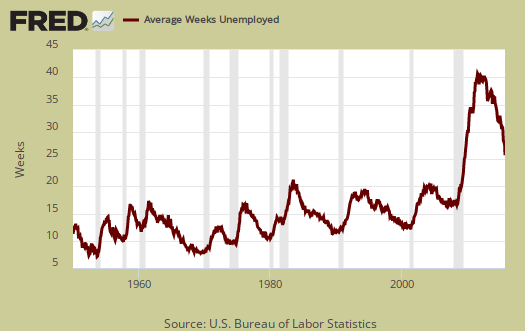
The median time one is unemployed, which means 50% of people have gotten a job in this amount of time is 11.4 weeks and decreased 0.7 weeks last month. A year ago the median time to be unemployed was 13.3 weeks.

This month's CPS report warns of a weakening employment situation. It is one of many indicators which show something not good is happening. Underneath the numbers shows a disturbing trend of people just dropping out of the count. The never ending low labor participation rates are just plunging and simply cannot be explained by baby boomers retiring. The only good news was the declining numbers of forced part-timers. Here are our past overviews CPS unemployment statistics, only graphs revised.
Recent comments