
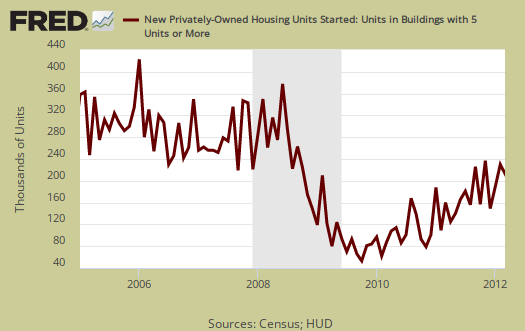
The March 2012 Residential construction report showed Housing starts decreased, -5.8%, from February's revised 694,000, to a level of 654,000. Housing starts have increased 10.3% from a year ago. Single family housing starts declined -0.2%. The -5.8% drop was due to apartments, 5 units or more of one building structure, which decreased -19.8% in one month.
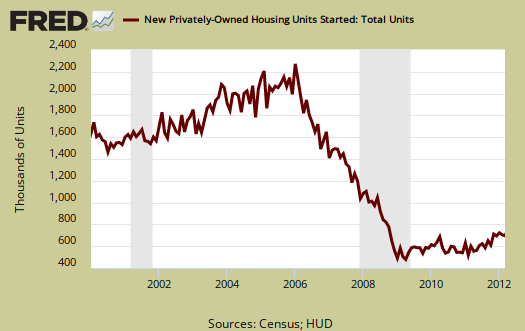
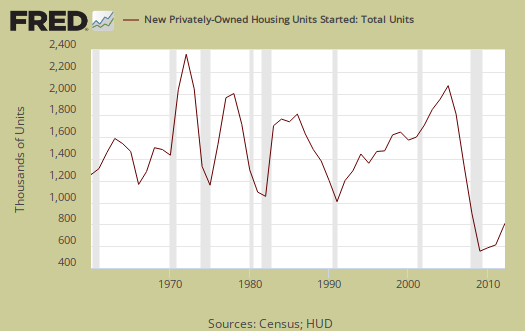
Housing starts are defined as when construction has broke ground, or started the excavation. One can see how badly the bubble burst on residential real estate in the below housing start graph going back all the way to 1960.
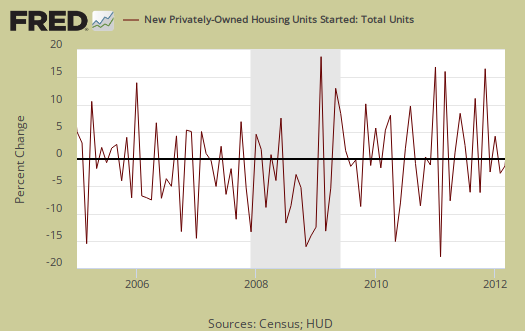
New Residential Construction has a margin of error often above the monthly percentage increases. This month has a error margin of ±15.6% percentage points on housing starts. Below is the monthly change so one can see the wild fluctuations.
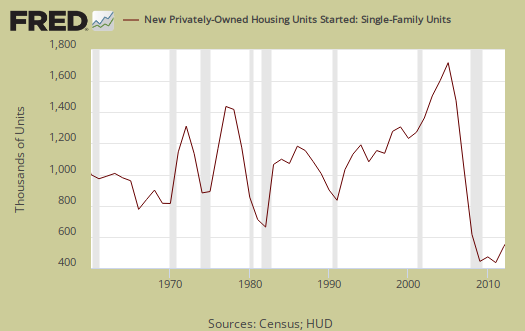
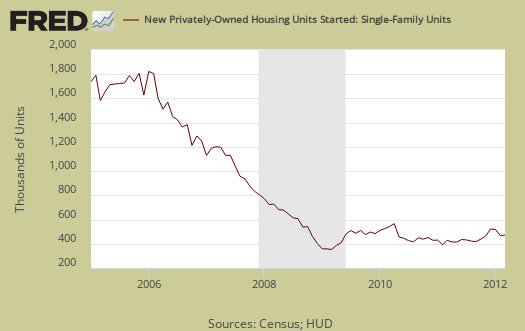
Single family housing is 75% of all residential housing starts. Below is the yearly graph of single family housing starts going back to 1960.
Housing of 5 or more units for 2011 has increased 8.5% from a year ago.
Building permits increased 4.5% to 747,000 and are up 30.1% from this time last year. Single family building permits increased 3.5% from last month. Building permits have much less statistical error, ±1.1%. Below is the St. Louis Federal Reserve FRED graph for Building permits. The graph shows building permits are not always a smooth line from month to month. Building permits are local jurisdictions giving approval, or authority to build.

Housing Completions increased 4.2% and are now up 0.5%, or flat line, from a year ago. This number reflects housing starts earlier reported. Housing completions mean either people have moved in or the carpet is laid done. In other words the house is done, including the flooring.
This report has a large variance, so to establish a trend line one must take into account months of data. This report is also seasonally adjusted and residential real estate is highly seasonal. The statistics are also annualized, which gives what the levels would be if one month's rates were the same for the entire year.
Below is the graph of single family housing starts on a monthly basis.
I recommend Calculated Risk, the uber site on housing data, for more graphs and analysis.
Recent comments