
The September 2010 monthly unemployment figures are out. The official unemployment rate stayed the same at 9.6% and the total jobs lost were -95,000. -159,000 government jobs were lost and private sector jobs increased by +64,000, with 16,900 of those jobs being temporary. -77,000 of the government jobs lost were temporary Census jobs. U6, or the broader unemployment measurement, jumped up to 17.1%. Minus Census jobs the U.S. lost -18,000 more jobs.

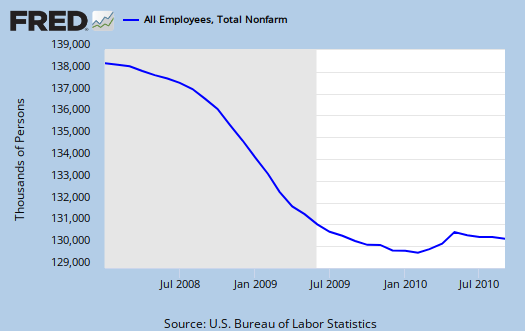
Below is the nonfarm payroll, seasonally adjusted. Notice the downward slope of the number of actual jobs.
Those not in the labor force increased by +175,000. The civilian labor force increased by 48,000. Of those in the civilian labor force, employed, increased 141,000 in September, yet those unemployed decreased -93,000. This explains the no change in the unemployment rate to 9.6%. Yet because there were no jobs, we can see more people fell off of the count.
The civilian population rose by 223,000, or 0.0% last month. The civilian population now stands at 238,322,000. Yet those not in the labor force are now an astounding 84,164,000.
Of those unemployed the number of re-entrants, or people trying again, increased by +25,000. New entrants into the job market who don't have a job decreased by -72,000. Take this as a perception measure that there simply are not jobs out there.
More telling, the change in the number of people who voluntarily left their jobs in September is -67,000. In other words, even fewer are quitting their jobs these days.

The change in those unemployed and counted was -93,000. The long term unemployed dropped by -126,000. But because we see no real job growth, this implies people are dropping from the count.
- Long term unemployed - 6.123 million
- Forced Part Time - 9.472 million
- Marginally attached to the labor force - 2.548 million
Of the Marginally attached, 1.209 million are discouraged. One of the most telling numbers is the increase in forced part time workers, up 612,000 in one month.

U6, defined as total unemployed, plus all persons marginally attached to the labor force, plus total employed part time for economic reasons, as a percent of the civilian labor force plus all persons marginally attached to the labor force, (table A.15), was 17.1%, a 0.4% increase from last month. This number is obscene. Then 41.7% of the official unemployed have been so for 27 weeks or longer.
One needs at least 125,000 and some estimate up to 300,000 permanent full time jobs, added each month just to keep pace with U.S. civilian workforce population growth. That's not general population, that's the group needing a job. To even get back to pre-recession unemployment rate levels we need a good 424,000 jobs created each month. That's permanent jobs.
The civilian labor force participation rate was flat, unchanged, at 64.7%. The employment to population ratio increased +0.1% to 58.5%.
These numbers are important because unemployment is a ratio, percentage. Many people are not counted in the official unemployment statistics, due to definitions, but obviously when one has more potential workers and less jobs, that metric doesn't bode well for America.

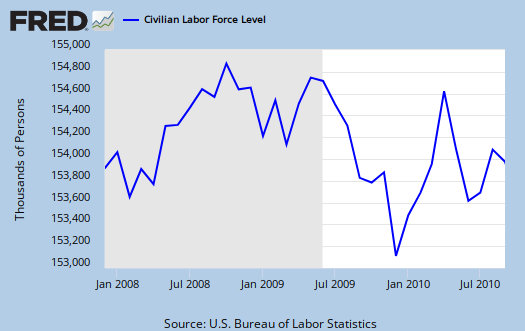
Below is the graph of the civilian non-institutional population, which is the largest super-set of the potential labor force, larger than the civilian workforce, due to those who are not looking for work, retired and so on being counted in this figure. It increased this month by 209,000. Unemployment is a percentage, a ratio.
The BLS unemployment report counts foreign temporary guest workers as well as illegal immigrants in their U.S. labor force statistics.

In looking over table B1 we can get a little more detail on what kind of jobs were created (and lost) on the permanent jobs front. These sectors include temporary jobs. OF Professional & Business Services, temporary jobs were 16,900. Without temp jobs, the sector lost jobs.
- Financial: -1,000
- Information: -5,000
- Construction: -21,000
- Manufacturing: -6,000
- Mining & Logging: +5,000
- Health and Education: +17,000
- Leisure and Hospitality: +38,000
- Professional & Business Services: +14,000
- Trade, Transportation, Utilities: +16,000
- Government: -159,000
All of the manufacturing job losses were in nondurable goods. Bear in mind illegal workers and foreign guest workers are counted as employed Americans, which can distort occupational sectors, particularly the Science and Technology ones. Below are the unemployment rates per occupational sector from table A-14, not seasonally adjusted. Government unemployment includes the recent temporary census workers. Look at how high information, professional and business services is. Tell me offshore outsourcing is not having an effect again.
- Financial: 6.3%
- Information: 10.8%
- Construction: 17.2%
- Manufacturing: 9.6%
- Mining & Gas, Oil: 8.2%
- Health and Education: 6.3%
- Leisure and Hospitality: 11.4%
- Professional & Business Services: 9.9%
- Retail, Wholesale Trade: 9.6%
- Government: 5.0%
- Agricultural: 11.1%
- Self-employed, unpaid family: 5.6%
You probably also want to know the birth/death model. What is that? It's a statistical adjustment to compensate for new businesses and dead businesses who are not actually tallied by data reports. Those jobs created and died outside the statistical reporting time window due to lag. So, the BLS estimates how many jobs can be attributed to those firms which are not actually counted. This month's adjustment was 11,000 jobs. Now one cannot directly subtract the birth/deal model monthly numbers, because unemployment data is seasonally adjusted, yet the birth/death adjustment is not seasonally adjusted, get that? Anywho, jobs attributed to new and dead businesses are just an estimate in so many words.
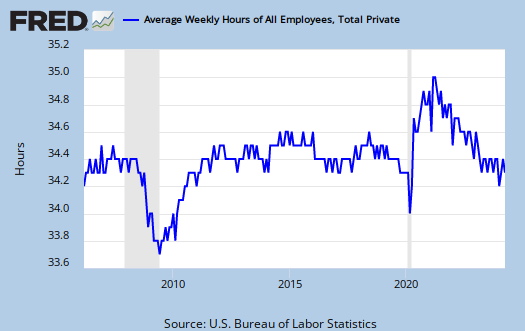
The average work week flat lined, 34.2 hrs/wk, same as the last two months. Average earnings (drum roll please), increased 1¢. What is astounding is how many industry sections are below full time. When the number of hours per worker is below full time, beyond the labor implications, there also is a common practice among employers to keep workers part-time, in order to deny them benefits.
Here is last month's report. There were revisions to the past two unemployment reports, both downward.
The change in total nonfarm payroll employment for July was revised from -54,000 to -66,000, and the change for August was revised from -54,000 to -57,000.
Subject Meta:
Forum Categories:
| Attachment | Size |
|---|---|
| 239.86 KB |
Unemployment not budging
Here is the latest unemployment chart, and it's just not budging down:
http://www.hiddenlevers.com/hl/u?bHIITW
Now compare unemployment and the S&P 500 over the last five years:
http://www.hiddenlevers.com/hl/u?akNYT9
The market has rebounded fiercely over the last 18 months while unemployment has been stuck in neutral. In the end, if hiring doesn't improve, unemployment may win this battle. We can't get back to a bull market without job creation and the associated consumer spending and economic growth.
EPI "missing" workers now at 3.5 million 2007-2010
EPI also changes down the "inbetween the lines" real numbers of the uncounted unemployed and estimates the total number of missing workers is now 3.5 million.
Their analysis (longer term, not monthly per say) is here (click here).