
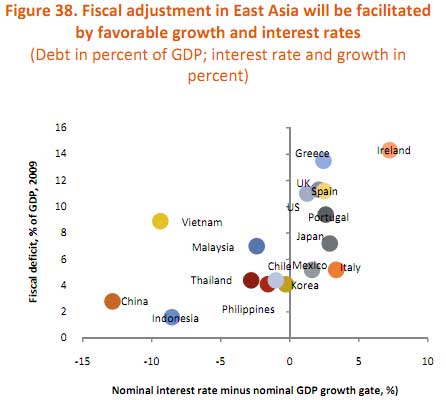
Contained within the World Bank Report on the East Asia Pacific region are two graphs. Both show how Asia countries are in great shape to reduce their deficits from stimulative spending during the Great Recession.
What is scary about these graphs is where the United States is. Remember Greece, Ireland, Spain, all of those pending sovereign defaults and implosions? Look at where the United States ranks in comparison to other nations.
One way to reduce debt is to bring in more tax revenues. This requires greater economic growth, full employment, assuming no change to tax policy. Below is the potential for the United States to grow our way out of debt. Notice how the growth is in China and Asia, projected.
Another way to reduce debt is to cut spending dramatically. Look at how much the United States needs to do to reduce our deficit.
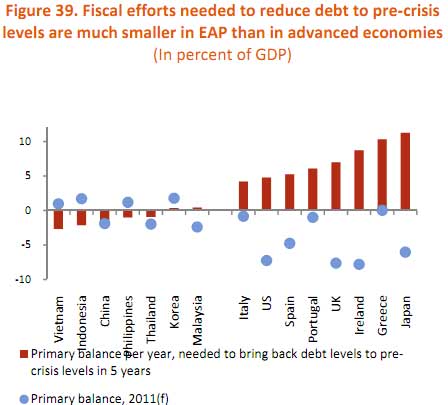
Notice beyond Japan, the countries who are worse off than the U.S. are the very countries where sovereign default was on the brink a few months ago and the IMF demanded Austerity. Perhaps it's a real good idea to get serious about dramatic economic growth and policies which support it? So far, any dramatic action in policy change never seems to happen.
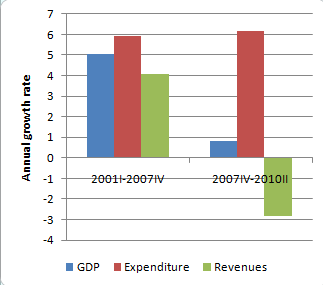
Economist Paul Krugman put together a graph from economic peaks on what has really happened to the overall economy. Look at the lack of real economic growth for the last decade, the infamous Bush tax cuts and the never ending rising deficit.
Recent comments