If you've been reading me this year, you know I have made a few highly contrarian calls that turned out to be correct. Most importantly, that after picking up early in the year, demand destruction during the recession that I already believed was happening, would cause inflation to fade strongly later in the year. As a corollary to that, when others were counting the days until $130 a barrel oil would hit $200, I called it a top, and started a Countdown to $100 Oil that turned out to be too tame! I also was among the first on the blogosphere to note that China's bubble was bursting and that the recession would go global, and that the markets feared deflation.
But there is one call I made over a year ago which now can be given a well-deserved burial: 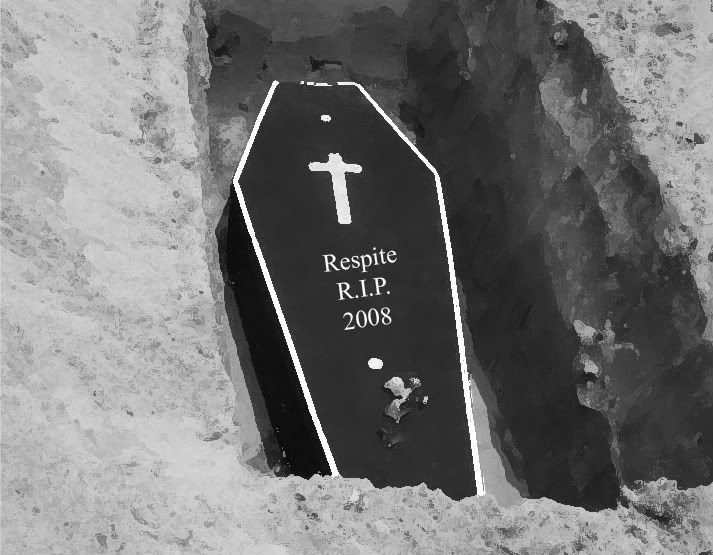 the notion that there would be a "respite" in the ongoing "slow motion bust" at some point before the end of 2008.
(Special thanks for the image above to Mr. Francesco)
The genesis of this call was a simple one: ever since the end of World War II, a span of over 60 years, the yield curve of the bond market has been a remarkably reliable indicator of recessions and recoveries. In particular, so long as the yield curve was "normal", i.e., the longer the bond maturity, the higher the interest rate, it was a nearly certain bet that 12 months later, the economy would be expanding. Contrarily, in particular if the 3 month bond had a higher interest rate than the 10 year bond, called an "inverted" yield curve, a recession almost always followed about 12 months later. Thus when in 2006 the yield curve inverted, I became alert for a 2007 recession, and in November 2006 I said it was likely within 12 months (it turned out to be 13).
By late September 2007, however, in the face of Fed rate cuts from 5.25% (that ultimately have gone all the way to 0%), the yield curve went ever so slightly positive again, and by the end of 2007 [black line on the below graph], it was straightforwardly and strongly positive:
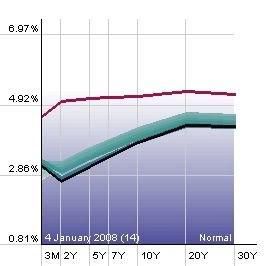
As I foresaw a recession deepening, and then inflation abating by late 2008, it appeared that the recession was on track to be relatively short and shallow, like 1991 and 2001, and so late in 2007 I began to predict a "respite" was likely to occur sometime late in 2008, perhaps arriving by election day. (In my worst moment, I thought that the economy might favor Sen. McCain on election day if that happened. No way. Even if a recovery were beginning, unemployment is the last thing to peak, and that's what voters notice the most). To that end, I cited a graph calculated by use of the yield curve and Fed interest rates at the site "political calculations" which appeared to show the recession at its deepest in Spring 2008. Ultimately, that graph called for a strong recovery to already be in place by November 2008, and here's the screen shot I took of that graph:
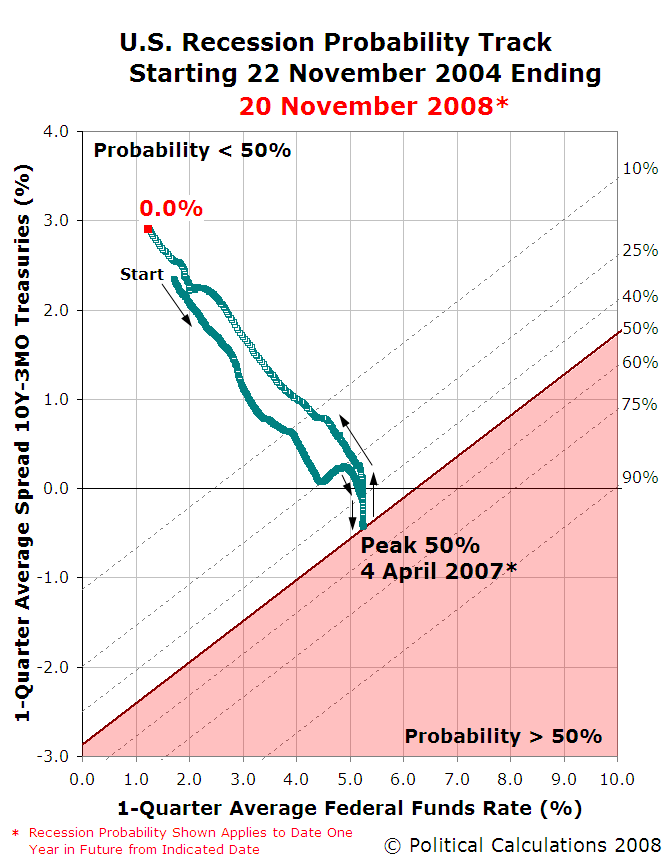
Anyone think we've bailed out of recession by November 2008? Umm, no.
In fairness to myself, as late as last week no less an institution than the Cleveland Fed was still touting the positive yield curve from last year as grounds to believe that the recession might be ending:
In the midst of the horrendous economic news of the last month, the yield curve might provide a slice of optimism. Though the yield curve has flattened since November, with long rates falling more than short rates, the difference between the rates remained strongly positive.
....
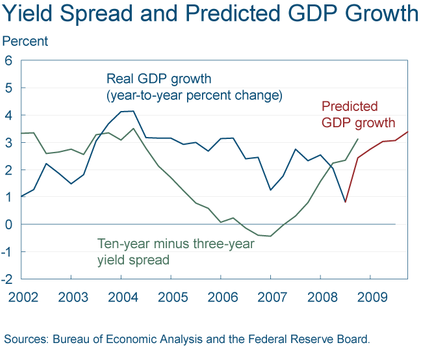
[The Cleveland Fed went on to discuss the historical reliability of the yield curve indicator, as shown on this graph:]
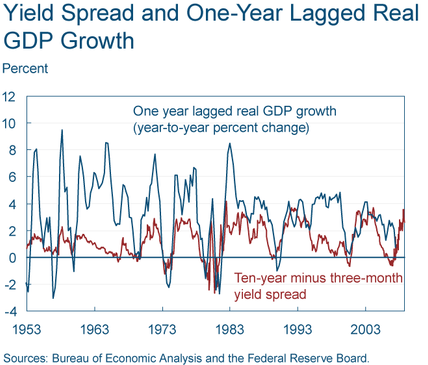
The flight to quality and the turmoil in the financial markets may affect the reliability of the yield curve as an indicator, but projecting forward using past values of the spread and GDP growth suggests that real GDP will grow at about a 3.0 percent rate over the next year
In contrast, I began to become concerned that if there were a flat-out deflation, a la pre-World War II economies, the yield curve was no longer operative, when I saw a graph generated by Ned Davis research that was reproduced by Andy Bebut a/k/a Theroxylandr, on his blog back in June. I zoomed in on the Great Depression era, and it was instantaneously and obviously clear that the post-World War II accuracy of the yield curve did not apply at all. In fact, if one were ignorant of history, the yield curve would suggest recovery during most of the 1929-32 disaster, and entirely missed the 1938 recession!
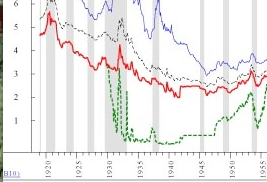
[note: In the above graph, red lines are the long term bond, the green line is the 3 month bond.]
I noted that I would still watch the yield curve, as it did appear to give different signals in deflationary times, and would watch carefully to see if deflation developed:
During the quarter century from 1929-54, an inverted yield curve didn't mean "recession", it meant catastrophe. And even a mild upward twitch from short term bonds (green in the top graph) was associated with recessions in 1938 and 1950....
I'm not going to jettison reliance on the yield curve as an important indicator of what lies ahead -- in both eras it did give useful, but differing, signals -- but I am going to correlate it with two of the most important other variables: money supply (M1 and M2), and also CPI (to determine what the "real" i.e., inflation adjusted interest rates are). I am also going to watch the rest of this year carefully to see how much our current paradigm comports with 1954-2004 vs. 1927-54.
Prof. Paul Krugman also believes that now "sad to say, the [positive] yield curve doesn’t offer any comfort. It’s only telling us what we already know: that conventional monetary policy has literally hit bottom."
Consistent with that caution, beginning in summer I began to look at money supply, especially M1, and noted by August that it was already increasing, causing me to think, along with the sudden decline in oil prices and the ending of the first wave of mortgage resets, that there were indeed the first signs of an end of the year respite.
But by the middle of Black September, I noted that
The crucial dynamic about the next portion of the "Slow Motion Panic" is whether Main Street comes down with pneumonia. "If Wall Street crashes, does Main Street follow? Not necessarily", says the Financial Times, recalling that the 1987 Wall Street stock crash left the Main Street economy almost completely unscathed. In our own present case, retail sales have declined slightly, and auto sales have crashed. Industrial production, chiefly centered around the auto industry, is also in decline, but not yet at levels equal to or greater than the relatively mild 2001 recession.
.
But the tools available to the Federal Reserve in 1987 -- cutting rates, getting stronger players to take over weaker brokerages, a vibrant underlying economy -- either don't exist now or have already been virtually exhausted. Moreover, as individuals feel the 25% losses in their retirement portfolios, it is realistic to expect that "fear itself" will finally take hold and consumer purchases will slow significantly. If so, this could begin another round of the vicious spiral as house prices fall further, leading to further writedowns in mortgage related collateral, leading to further financial calamities and further consumer fear.
And by October 8 in discussing the stock market crash I noted
What is happening now is that for the first time in 70 years, the forces of deflation are overcoming the forces of inflation. Assets: houses, stocks, land -- are all declining in price....
.
This kind of commodity collapse does not happen in an inflationary environment, but is exactly what you would expect from an old fashioned panic or bust from the 1800s or early 1900s.
....
One thing we learned from studying the 1929-33 Great Depression is that once deflation has taken root, it can be vicious and relentless until all debt has been destroyed. In August we had a significant negative number for the consumer price index, and I suspect September's number will be significantly negative as well. And the deflationary contraction will be most severe in the face of an inverted yield curve, which if we use the interbank lending rate, is exactly what we have now....
.
A "tight money" yield curve, where short term money is more expensive than long term money, and rapid and severe consumer retrenchment, brought on by and reinforcing the vacuum of deflation, is exactly what happened in 1929, and ... it may be exactly what is happening now. At very least, the "invisible hand" of the markets suspects that the deflationary spiral may have started.
After the Administration and Congress's "Be afraid, be very afraid" rhetoric during Black September, the only question remaining was whether low gasoline prices and the Fed's ginormous pump-priming of M1 money supply would be enough to overcome the deflationary vortex:
This utter collapse in oil prices is means that gasoline, which averaged about $4.10 a gallon at its peak in July, could be as cheap as $1.99 a gallon by election day, a stunning decline! This is beyond question going to put more money in consumers' wallets. Although there is much gloomy news in industrial production, retail sales, consumer sentiment, and manufacturing from September, if the various financial stimuli take some effect, that may be enough to give us the brief respite during the "slow motion bust." The next few weeks' data of money supply and October readings in producer price and food inflation will tell us if it is indeed so.
What the next few weeks' data showed, was that instead of "bungee-jumping", as employers began almost instantaneously to lay off workers at an alarming pace, the consumer capitulation, at least for more expensive items, has deepened. The deflationary bust now appears to be in a self-reinforcing vicious cycle of consumer and producer retrenchment.
So, while the Fed's pump-priming, which I've described as an experiment in real time to see if Milton Friedman's Great Depression monetary theory is correct or not, may yet succeed in enabling an anemic recovery at some point next year, the deflationary bust brought about by the consumer retrenchment in the wake of Black September for now reigns supreme. With apologies to Prof. Krugman, whom I greatly admire, the problem is not what the yield curve shows now, it is with what it showed beginning 15 months ago. What we have learned is that the moment there is debt deflation (as began in July of this year), a positive yield curve instantaneously is virtually meaningless.
Respite R.I.P. Stillborn 2008.

Comments
image is awesome
What a great image that is. I also find the insight of of the Fed seeing if Milton Friedman's monetary policy is correct in real time a great line.
Pump priming not nearly enough
Near as I can tell, the FED is about $12 Trillion short of what we really need: an elimination of the "Culture of Debt". We need enough liquidity that investing in a new business can be done out of pocket change. Which means M1 Available Dollars must => GDP.
Two ways to get there- quick and slow.
Quick is the government abandons this stupid idea of borrowing money from itself, prints the dollars, and starts spending on stuff we need like Universal Health Care, Universal Fiber-To-The-Door internet, electric transportation, and existing Infrastructure Repair.
Slow is that we cut production, and jobs, raising unemployment until GDP <= M1.
-------------------------------------
Maximum jobs, not maximum profits.
Very informative my friend.
Very informative my friend. I always learn alot while reading your blog post. I look forward to what you have to say in 2009 because I strongly feel the problems of 08 are not fully buried yet and we are still a while away from normalcy.
Fantastic post
As always, my good man.