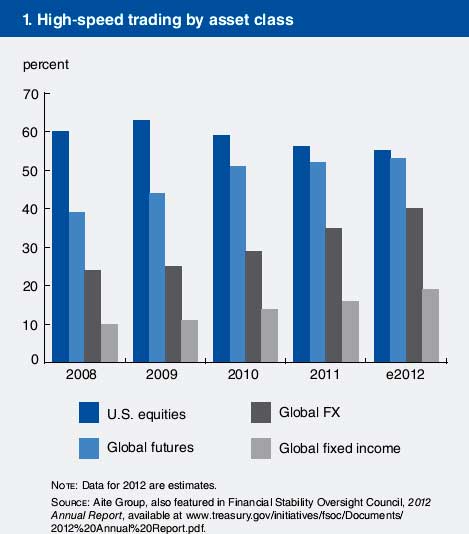
We hear all sorts of reasons why the little guy won't buy stocks these days but the below graph, courtesy of a Chicago Fed study, might explain a lot of it.
The U.S. international transactions release is an odd duck. The current account is kind of like an economic income statement of the U.S. vs. the rest of the world. The current account deficit was $117.4 billion for Q2 2012, a 12.1% decline from Q1's current account deficit of $133.6 billion.
The Obama Administration is committed to protecting the rights of nearly 800,000 American workers in our $350 billion auto and auto parts manufacturing sector.
Export subsidies are prohibited under WTO rules because they are unfair and severely distort international trade. China expressly agreed to eliminate all export subsidies when it joined the WTO in 2001. China benefits from international trade rules and must in turn live up to its international obligations.
While this action is long overdue, the realty is this administration has been complicit with China, refusing to label them a currency manipulator. Additionally the Obama administration has passed even more bad trade deals and is working on a mega bad trade agreement, the TPP.
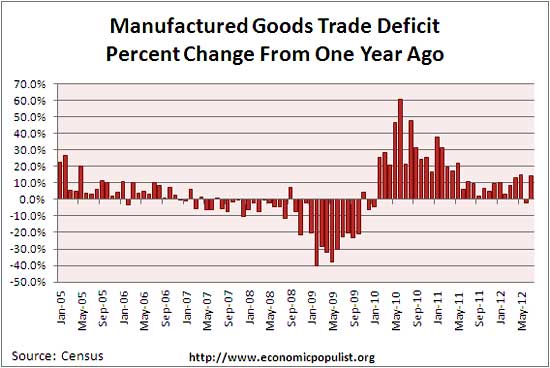
While Chinese auto part imports have surged 25% in the last two years, so has the overall manufacturing trade deficit. Below is the percent change from a year ago in the manufactured goods trade deficit. This trade deficit has increased 14% from one year ago and 26.3% from two years ago.
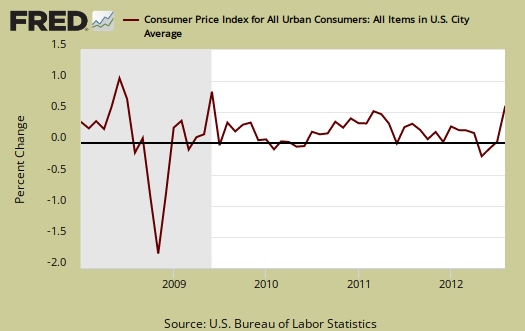
The August Consumer Price Index, which measures inflation, increased 0.6% from July. This is the largest monthly increase since June 2009 and the reason for the jump is 80% gasoline prices. The CPI gasoline index increased a whopping 9.0% in a month. When removing food and energy inflation, of which gasoline is a part, core inflation increased 0.1% for August. Below is CPI's monthly percentage change.
CPI is up 1.7% from a year ago, shown in the below graph.
The Federal Reserve's Industrial Production & Capacity Utilization report, G.17, shows a decrease of -1.2% in industrial production for August 2012 and Hurricane Isaac is blamed for 0.3% of that decrease. This report is also known as output for factories and mines. Manufacturing declined -0.7%, mining -1.8% and utilities a whopping -3.6%.
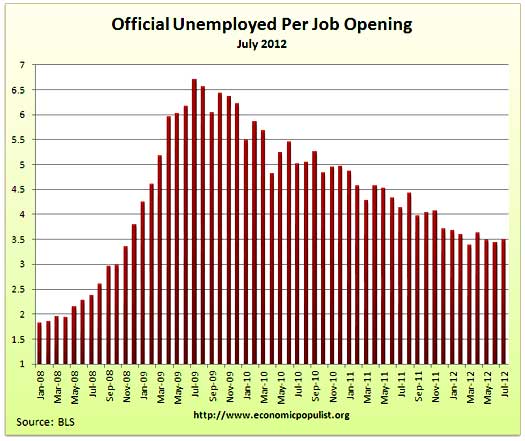
The BLS JOLTS report, or Job Openings and Labor Turnover Survey describes the pathetic job market. Once again, little has changed and the July 2012 statistics show there were 3.49 official unemployed persons for every position available*. There were 3.664 million job openings for July 2012, a 1.56% decrease from the previous month of 3,722,000. Openings are still way below pre-recession levels of 4.7 million. Job openings have increased 68% from their July 2009 Mariana Trench trough, yet real hiring is a distant memory. There were 1.8 persons per job opening at the start of the recession, December 2007. The job market is horrific and worse than last month. Below is the graph of July official unemployed, 12.794 million, per job opening.
The QE3 has been officially launched today by the Federal Reserve, which has promised to buy $40 billion of asset-backed securities from the market each month, on top of $35 billion per month of Treasury securities it is already buying as part of its program to reinvest proceeds from securities which are maturing in its existing portfolio. If this isn’t enough to excite the animal spirits of the economy, the Fed has put no limit or end-date on QE3, and it has pushed out its promise to keep short term interest rates near zero for at least the next 2-1/2 years.
Why is the Fed buying mortgage-backed securities and not Treasuries, which it bought under QE1 and QE2? In the past fiscal year for the US government, the Fed purchased 77% of all the new debt issued by the Treasury, and because the Fed focused its purchases in the 10 year and beyond maturities, the Fed is bumping up against its self-imposed limit of not owning more than 70% of the outstanding paper in any maturity. The Fed is already close to this limit for maturities clustered around the 10 year mark, and the Fed owns on average 50% of all the outstanding paper in the 10 year to 30 year maturities. As Republicans have made clear in this election year, every Treasury purchased by the Fed is viewed as an attempt to influence the election of Obama, so this is a potent political reason to stay out of this market for the time being.
The Producer Price Index, or wholesale inflation, increased 1.7% in August 2012 for finished goods and is the largest monthly increase since June 2009. Energy alone ballooned by 6.4% with gasoline prices surging 13.6% in August. Food also jumped by 0.9%, the highest jump since November 2011. Core PPI, which is finished goods minus food and energy, increased 0.2% although July's core PPI increased by 0.4%.

 Welcome to the weekly roundup of great articles, facts and figures. These are the economic and financial finds that made our eyes pop.
Recent comments