The Obama administration is finally abandoning their endorsement of chained CPI for next years budget. The reason is probably not good economics, but political. Election season is near and this is just one of many policies the Obama administration endorsed which raised the ire of the retired. A refresher, chained CPI is another method to adjust for cost of living increases at a reduced rate than what is currently used, CPI-W.
Surprise, when tax revenues increase the deficit goes down. Such was the news of a new CBO update on the federal budget deficit.
If the current laws that govern federal taxes and spending do not change, the budget deficit will shrink this year to $642 billion, CBO estimates, the smallest shortfall since 2008.
There is a war on social security and America is losing the battle. One constant in the fiscal cliff negotiations is the agenda to cut your retirement benefits by a ruse, a lowering of the inflation adjustment.
Every once in a while we see a piece of data which makes the hair on our heads stand on end. Such is the Census Foreign Trade graph of the month. Below are corn exports and their percent change a year from June 2012.
The more orange a state is, the more their exports declined. Texas corn exports declined a whopping -272.6%, Kansas dropped -160.9%. Arkansas is a real disaster, with a -445.2% drop in corn exports as of June 2012. What's worse is the June data only gives a 10% national drop in corn exports from a year ago. July gave much worse figures.
By July 2012, the United States corn export decline was the lowest in 19 years and had dropped 40% from a year ago according to the latest USDA statistics. The U.S. is the largest exporter of corn and corn is the largest export of course-grains. The below charts are from the USDA grain report.
After putting controversial cuts to Social Security and Medicare on the table in negotiations with congressional Republicans over a plan to raise the nation's debt ceiling, President Obama still doesn't have a deal in the works. Emerging from a meeting with congressional leaders on Thursday, Obama said that both sides in the negotiations would find the ultimate outcome "painful." He also explained that the two sides had not yet arrived at an accord, but would reconvene talks on Sunday.
"I want to emphasize that nothing is agreed to until everything is agreed to," Obama said, adding that the talks were conducted "in a spirit of compromise" but that the parties "are still far apart on a wide range of issues."
Today the ECRI Weekly Leading Index was at 9.8%. Notice from the graphs below, (fxmarketalerts.com), this index was -10% around the start of this recession.
This morning the BLS reported that consumer inflation remained unchanged (seasonally adjusted) in June, declining -0.2% NSA. Year-over-year prices have fallen - 2.1% into deflation. YoY consumer deflation is only surpassed by 1949's -2.9% in the post-Depression era.
The 2009 first half inflation data unfolded in accord with the optimistic scenario I laid out in January:
In the Optimistic scenario, the fiscal and monetary stimuli, together with intelligent new political leadership in Washington, halt the meltdown perhaps by mid-year, and wage reductions remain the exception. In the Pessimistic scenario, the stimuli fail, and wage reductions spread, leading to a wage-price deflationary spiral.
This is a continuation of a monthly series that up until now has been called The Deflationary Bust Deepens. Each month I have been tracking the progress of this first full-fledged deflationary bust in over 50 years, comparing the progress of deflationary consumer and producer prices now with the pattern of the 5 deflationary busts between 1920-1950, including the Great Depression.
Yesterday morning the BLS reported that consumer inflation increased +0.7% (seasonally adjusted) in June, (rising 0.9% non-seasonally adjusted). Year-over-year prices have fallen - 1.4% (NSA) into deflation. YoY consumer deflation is only surpassed by 1949's -2.9% in the post-Depression era.
This morning the BLS reported that consumer inflation increased +0.1% (seasonally adjusted) in May, (rising 0.3% non-seasonally adjusted). Year-over-year prices have fallen -1.3% into deflation. YoY consumer deflation is only surpassed by 1949 in the post-Depression era.
The first 5 months of inflation data are still in accord with the optimistic scenario I laid out in January:
In the Optimistic scenario, the fiscal and monetary stimuli, together with intelligent new political leadership in Washington, halt the meltdown perhaps by mid-year, and wage reductions remain the exception. In the Pessimistic scenario, the stimuli fail, and wage reductions spread, leading to a wage-price deflationary spiral.


 Welcome to the weekly roundup of great articles, facts and figures. These are the weekly finds that made our eyes pop.
  There is a war on social security and America is losing the battle. One constant in the
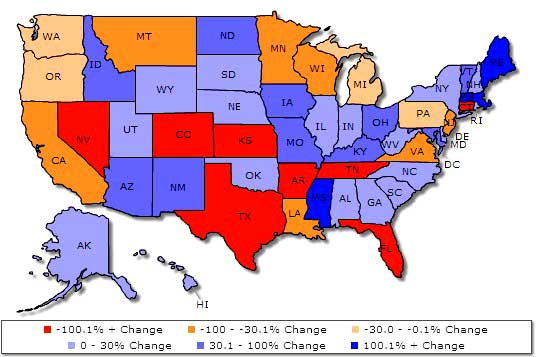

Recent comments