
With stories of food riots in third world countries and $4 a gallon gasoline by this summer, inflation certainly seems to be rampaging. Whether this continues or not is not just of concern to market watchers. Aside from the incredible pain food inflation in particular puts on the poor worldwide, domestically US workers are never going to get raises to match inflation rates much in excess of 3%. So, the more necessities like food and gasoline go up in price, the less Americans have to spend on other things, like mortgage payments, health care premiums, or educating their children, let alone retirement savings. In short, the worse inflation stays, the more severe our recession will be.
I addressed this issue previously in a post entitled Why Inflation isn't the problem in which I said:
So, it isn't inflation which will be the problem in 2008. Rather, it will be the widening and deepening recession as average Americans cut back and take a decline in their standard of living as they try to pay the high costs of food and gasoline, whether those prices briefly continue to increase, remain the same, or even decline slightly
In this diary I will flesh out some of the reasoning why I believe we are close to the cyclical peak in consumer inflation. By looking at past recessions that were brought about by spikes in food and energy costs, and trends underlying current energy prices, I believe a good educated guess can be made that we are very close to a peak in inflation, which is likely to subside by the last 3 months of this year.
This isn't the first time that food and most especially gasoline prices have caused a spike in inflation, and brought about a recession. Here is a graph of the year-over-year change in food prices (in green, scale on the left) and oil prices (in red, scale on the right) from 1970 to the present:
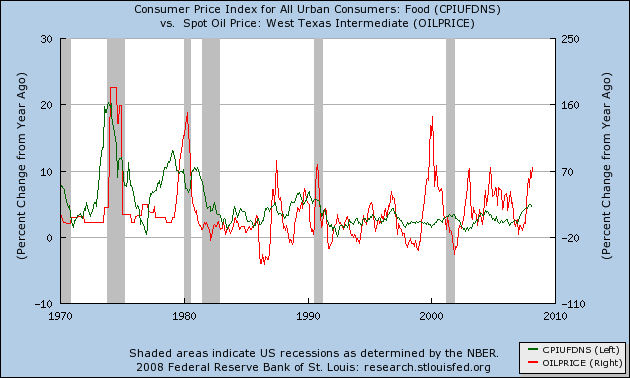
It's pretty easy to see that at least 3 dramatic increases in the price of oil have coincided with recessions: in 1974, in 1980, and in 1990. The price of food rose dramatically also at the time of or just prior to all three recessions as well. (the dramatic %age increase in oil in 1999 is a false alarm. Oil had actually declined dramatically in 1998 from its 1990s average of $20, to $12 a barrel, so the year over year increase to about $35 a barrel looks worse than it actually was at the time. And indeed the 2001 recession was a business retrenchment due to the popping of the internet bubble. Consumers were generally unaffected).
Let's look more closely at how inflation behaved during each 3 of the oil/food related consumer recessions. In all the graphs below, the year over year inflation rate is in blue, food inflation in green, both measured on the left index; and oil inflation is in red, measured on the right index.
Here's 1974:
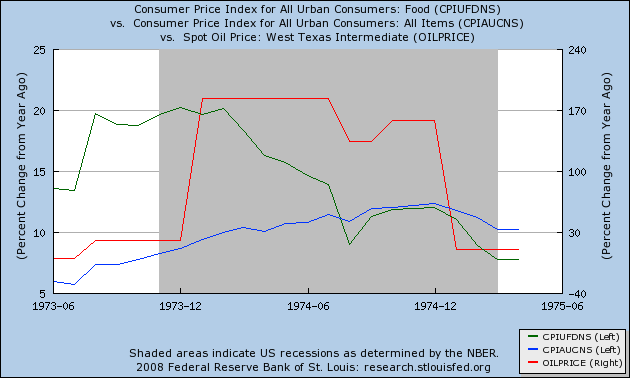
Note that food prices were up 20% year over year in late 1973 and the inflation rate for food started to decline 3 months in to the recession. But with the Arab oil embargo of 1974, gas prices virtually overnight nearly tripled, from $3.75 a barrel in early 1973 to $4.25 in late 1973, to $10 a barrel in January 1974! It took a full year after the recession struck for consumer inflation rate to peak, at about 12%.
Here's 1980:
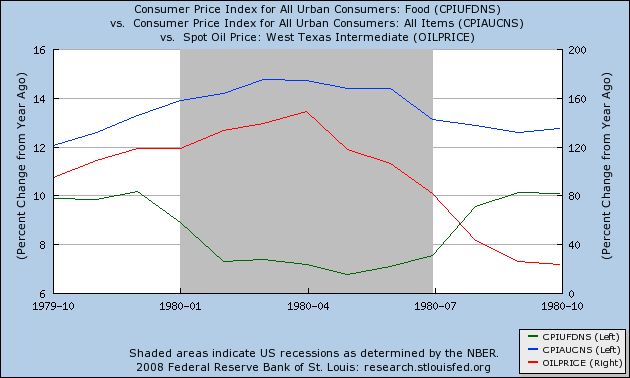
Again, notice that food inflation actually peaked a few months before the recession began. Oil inflation, however, continued to increase for 3 months into the recession (from $15 a barrel at the end of 1978 to $40 a barrel by mid-1980). The consumer inflation rate peaked one month previous to the oil peak, only 2 months into the recession, at a whopping 14.5% !
Here's 1990:
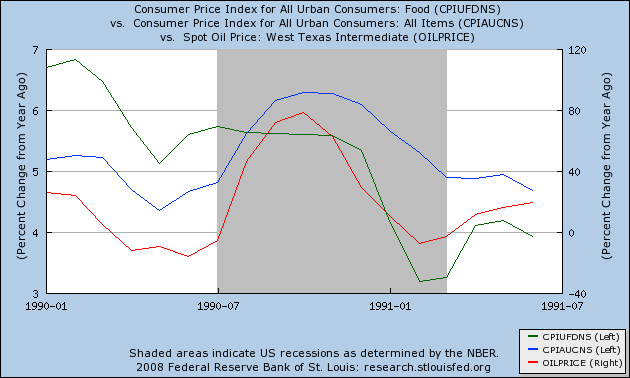
The 1990 graph is similar to the 1980 graph, but more subdued. Food inflation once again peaked the year before. Oil inflation again peaked 3 months into the recession (in the 8 months from July 1990 to March 1991, oil went from under $20 a barrel to over $35 and back to $20 again). The consumer inflation rate also peaked 3 months into the recession, at a rate over 6%.
Finally, here's the current graph:
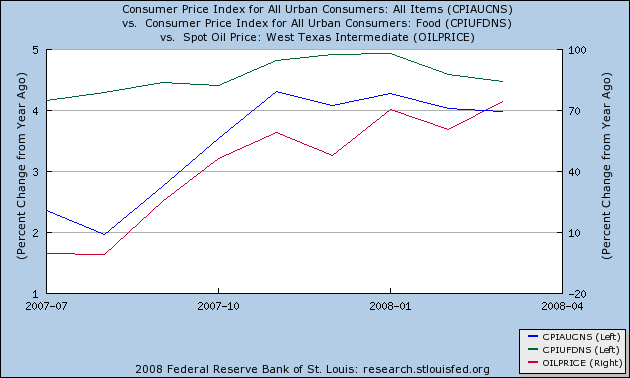
It looks quite possible that food inflation has just peaked. Oil inflation was still increasing in March. So it seems likely that overall consumer inflation hasn't peaked yet.
Since both in 1980 and 1990, inflation as measured by the consumer price index peaked within a month of the peak year over year increase in oil inflation, looking at the inflation rate in oil prices in the last year can give us important clues as to when consumer inflation might peak. Below is the table of oil prices for the last 2 years that was used to generate the graphs above. Note that oil prices peaked at $74 a barrel in July 2006, then declined to $55 a barrel in January 2007, and since then oil prices have doubled to $110 a barrel now. From March 2007 to March 2008, went up 75%. Is it likely that oil prices will continue to have increased at a rate of 75% a year or more in the coming months of 2008? We can find out by adding 75% to the price from subseequent months of 2007. The results are in parentheses to the right:
2006-07-01 74.410
2006-08-01 73.050
2006-09-01 63.870
2006-10-01 58.880
2006-11-01 59.370
2006-12-01 62.030
2007-01-01 54.570
2007-02-01 59.260
2007-03-01 60.560
2007-04-01 63.970 (x 1.75 = 111.95)
2007-05-01 63.460 (x 1.75 = 111.06)
2007-06-01 67.480 (x 1.75 = 118.09)
2007-07-01 74.180 (x 1.75 = 129.82)
2007-08-01 72.390 (x 1.75 = 126.68)
2007-09-01 79.930 (x 1.75 = 139.88)
2007-10-01 86.200 (x 1.75 = 150.85)
2007-11-01 94.620 (x 1.75 = 165,58)
2007-12-01 91.730
2008-01-01 92.950
2008-02-01 95.350
2008-03-01 105.560
It seems quite likely that at some point in the next couple of months, oil will have increased more than 75% a year. By October, however, it seems quite unlikely that oil will be priced at $150 a barrel or higher. It only rose from $100 to $110 in the last 3 months. If that rate of increase continues, it will be at $121 a barrel in July and $133 a barrel in October. (even adding in the spurt to $115 this week only gets us to about ~$140/barrel in October).
A second way to look at past recessionary episodes is to note that oil tended to spurt in price and then hold steady of lengthy periods of time, as in this graph that is in log scale, so equal percentage moves show up equally:
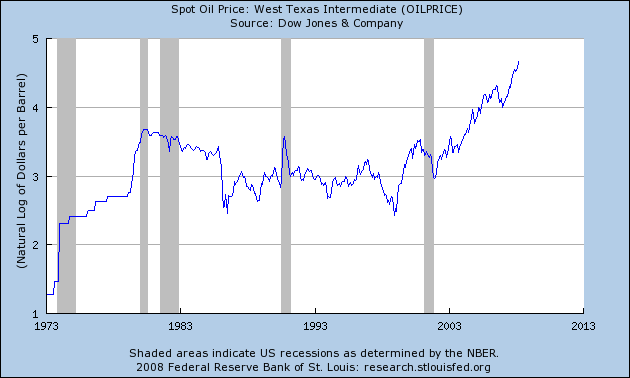
Note that previous spikes steadied or reversed quickly: the 1974 spike steadied in just over 12 months; the 1980 spike in 18 months, the 1990 spike reversed in 8. Our current spike started from $55 in January 2007. If the past patten holds true, the spike in oil prices should end by this summer sometime.
And indeed, as this report by the Dept. of Energy demonstrates, domestic US demand for gasoline is falling:
Gasoline consumption has been declining for at least six months....
[D]uring the second half of 2007, gasoline consumption declined by 0.1 percent from the year before. In fact, fourth-quarter consumption fell by 0.4 percent. The drop in gasoline consumption, the first since the recession of 2000, should come as no surprise with the slowing economy and soaring gasoline prices.
The first quarter of 2008 continued to show an even sharper decline in consumption of 0.6 percent compared to the same period in 2007.
In conclusion, if this recession follows the patterns of the 1974, 1980 and 1990 recessions, the CPI measure of inflation, which reached recent highs of 4.3% in November 2007 and January 2008, may continue to climb for a few more months, perhaps reaching 5% or more sometime between now and the end of summer, before declining for the remainder of the year. {Note that this analysis holds true even if the BLS has been systematically underreporting consumer inflation, i.e., as long as the bias has been consistent). To put it another way, when the uptrend identified by bonddad on this graph breaks,
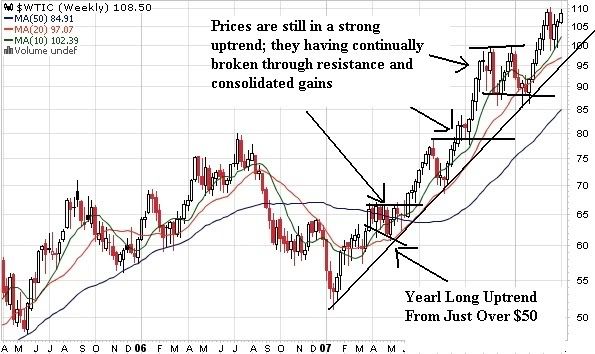
CPI inflation will have peaked.
Why should you care? Because the sooner inflation simmers down, the less painful the recession will be to the American consumer. If it does begin to simmer down by Labor Day, then compared with the alternative, that is good news.
Comments
I don't know
This history to me isn't taking into account the increasing demand of oil in China, India and other fast growing economies. Add Peak Oil to that plus whatever the hell this Iraq mess is, I don't see oil returning to steady state, or has the potential to not return to steady state at least.
Opps, I forgot the tanking dollar in that as well as Dubai and a series of other nations talking about decoupling from the US economy and the dollar.
Well...
You've raised both points I figured might be brought up...
In the first place, I'm always skeptical of arguments that boil down to "It's different this time."
Secondly, while 1974 and 1990 can be put down to transient interruptions in the supply of oil (Arab oil embargo, Saddam's invasion of Kuwait), 1980 cannot. OPEC was producing a certain amount of oil, and jacked the price up so high the entire world went into recession. Over the period of a year or two, "peak oil" doesn't make a difference on the amount of oil available to consuming countries.
Thirdly, as to the argument that China et al. are continuing to grow and so will oil demand, I give you the Shanghai stock exchange:
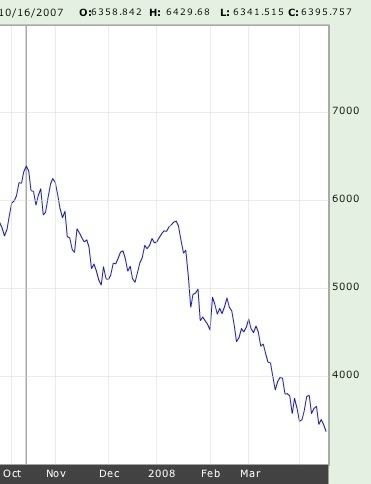
down almost 50% (more precisely, 47.5%) in a little over 6 months. Now what do you suppose that might be telling us about China's economy?
Check out McMillion
His report on China in the studies section. It's downright scary so I think the Shanghai report really isn't tell that much. They are flush with cash.
Update re April 2008 CPI
I wanted to make a new blog post, but the BLS site is apparently overwhelmed, so I haven't been able to download updated charts.
The April CPI is noteworthy in two respects: (1) the overall CPI is again at under 4% year-over-year, less than its recent peak 6 months ago of 4.3%; and (2) the rate of food inflation has abated significantly in the last few months. This doesn't mean that food prices aren't going up, it means that they are going up less than they were before. That is significant because as I've analyzed previous oil-shock induced recessions, food inflation peaks first, before energy and typically before the overall rate, both of which tend to peak about 3-6 months into the recession.
It's all about oil now.