
You know an economic report is bleak when the title contains dismal start. Such is the S&P/Case-Shiller Home Price indexes report for January 2011. The composite indexes hit new lows, with the home prices of the 20 cities composite index being down -3.1% and the composite-10 dropping -2.0% in comparison to January 2010. Literally, in the report, we have this:
We have seen all statistics bounce along their troughs; at worst, the feared double-dip recession may be materializing.

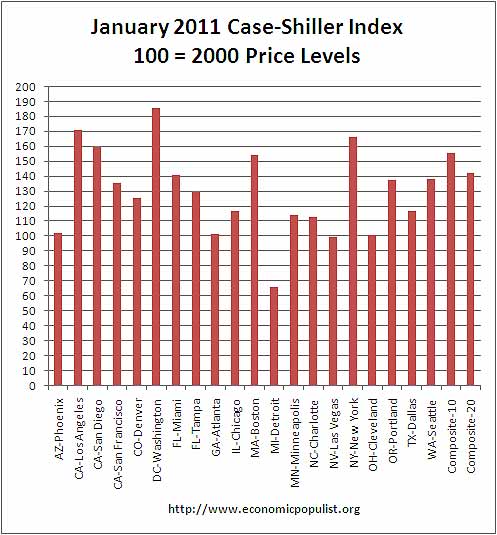
The above graph shows the composite-10 and composite-20 city home prices indexes. Prices are normalized to the year 2000, so the index value of 150 means single family housing prices have appreciated, or increased 50% since 2000 in that particular region. For the December to January percentage change, the composite-10 index is -0.9% lower and the composite-20 is -1.0%.
Below is the yearly percent change in the composite-10 and composite-20 Case-Shiller Indices. As you can see, there is clearly a new decline going on for 2011. This is what is meant by double-dip in declining home prices..

David M. Blitzer, Chairman of the Index Committee at Standard & Poor's:
Keeping with the trends set in late 2010, January brings us weakening home prices with no real hope in sight for the near future. With this month’s data, we find the same 11 MSAs posting new recent index lows. The 10-City and 20-City Composites continue to decline month-over-month and have posted monthly declines for six consecutive months now.
These data confirm what we have seen with recent housing starts and sales reports. The housing market recession is not yet over, and none of the statistics are indicating any form of sustained recovery. At most, we have seen all statistics bounce along their troughs; at worst, the feared double-dip recession may be materializing. A few months ago we defined a double-dip for home prices as seeing the 10- and 20-City Composites set new post-peak lows. The 10-City Composite is still 2.8% above and the 20-City is 1.1% above their respective April 2009 lows, but both series have moved closer to a confirmed double-dip for six consecutive months. At this point we are not too far off, and that is what many analysts are seeing with
sales, starts and inventory data too.Looking across some of the markets, we see that with a January 2011 index level of 99.59, Atlanta has joined Cleveland, Detroit and Las Vegas as markets where average home prices are now below their January 2000 levels. Washington DC appears to be the only market that has weathered the recent storm.
While it was up only 0.1% for the month of January, it’s annual rate was a relatively healthy +3.6%, it is still +10.7% above its March 2009 low, and ranks number one among the 20 markets as its average value is almost 85% above its January 2000 level.
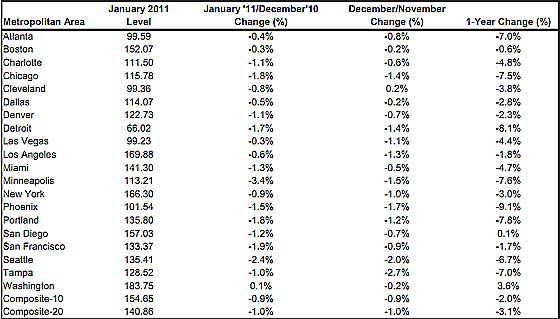
Below is a table are all of the cities of the composite-20 index. This should give a feel for the bubble and now current devaluations. Notice the stronger correlations in price declines to the unemployment rate and lack of job growth, such as Detroit.
In Q1 2009, home prices dropped 18.9%. As S&P reports, the Composite-10 is 2.8% above the April low and the Composite-20 is 1.1% above the April low. This is what S&P means by a true double dip and dismal report.
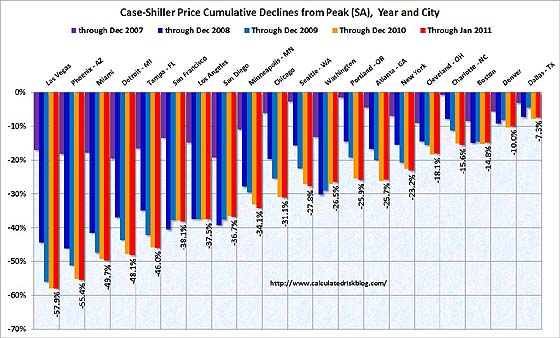
The graph below, from Calculated Risk, shows how much prices have fallen from their peaks in the Composite-10 cities. Calculated Risk has additional custom graphs and data analysis and is the uber site for residential housing data and graphs.
Case in point, Calculated Risk is running a rent in comparison to home ownership graph and quoting some estimating home prices will drop another 20-30%.
S&P does a great job of making the Case-Shiller data and details available for further information and analysis on their website.
Recent comments