
The Consumer Price Index for January 2011 increased 0.4% from last month. For the year, the Consumer Price Index for all Urban Consumers (CPI-U) has risen 1.6%. December CPI was revised to 0.4%.
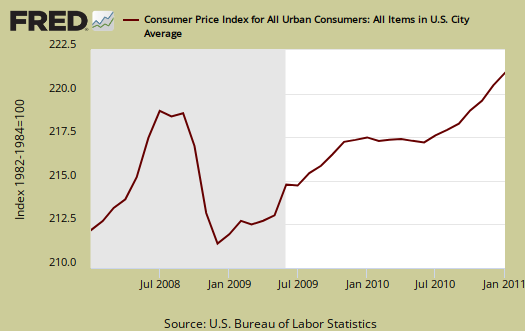
Food at home jumped, 0.7% for January, Gas alone rose 3.5% from December prices. For the year, Gas is up 13.4%, fuel oil up 17.5% and Food at home has increased 2.1%. Heating your house with gas, on the other hand, dropped -6.4% for the year.
Below is the monthly percentage change in CPI-U.

From the report:
Increases in indexes for energy commodities and for food accounted for over two thirds of the all items increase. The indexes for gasoline and fuel oil both increased in January, continuing their recent strong upward trend. The index for food at home posted its largest increase in over two years with all six major grocery store food group indexes rising.
The graph below is food, which includes food at home and restaurants. Included is the deflationary period during this recession.

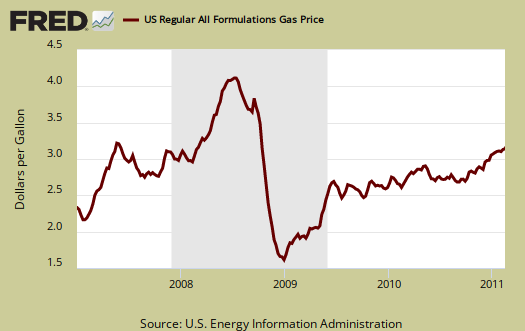
While the buzz maybe food and indeed, there have been crop failures around the world, it is Oil and Commodities that are really rearing their ugly heads. Many are warning on oil prices wrecking havoc with the economy in 2011. Below are gas prices, last updated February 14th. Notice the oil bubble in early 2008.
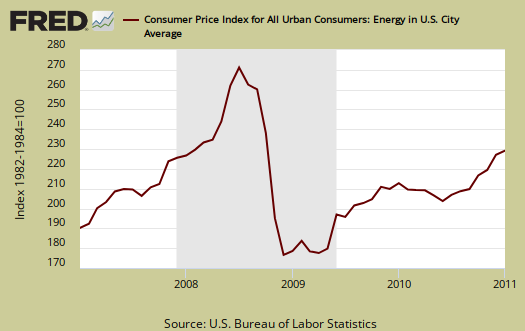
The CPI energy index, below, shows how the great recession actually stopped the oil bubble, which appears to be roaring back. This index is all energy, gas, natural gas, fuel oil and so on. Notice it's dip and return versus the food index.
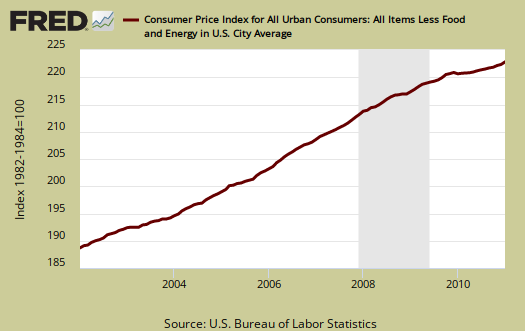
Core CPI, or all items less food and energy, also increased, 0.2%. For the year, core CPI, or minus food and energy, is off it's record lows, now at 1.0%.
Core CPI's percentage change is graphed below. As we can see, overall, without energy and food, inflation is pretty tame. That said, core CPI includes housing, shelter, which rose 0.1% this month and is only 0.6% of an increase for the year.

Below is the St. Louis FRED graph to show the overall rate of change on core CPI, or CPI without food and energy included. Notice how the line isn't rising as fast after the dip in 2008.
There has been much criticism as of late that the Federal Reserve only focuses in on core CPI, instead of food and energy. According to the BLS, Food and beverages, which includes food at home, makes up 14.8% of the index. Housing is 41.5% and transportation, including gas for the car, is 17.3%. Medicare care is only 6.6%. All items minus food and energy are considered 77.2% of the total price expenditures for consumers.
The DOL/BLS does take yearly surveys on where the money goes in the monthly budget, but as one can see, food and energy are significant amounts of the monthly finances. Run away costs in these two areas can break the bank. Considering we have price deflation in housing due to the real estate sector bubble pop, it's strange for food and energy consumer prices to be dismissed when crafting monetary policy.
CPI-W for the month, unadjusted was 216.400, a 0.5% increase from last month and a 1.8% increase for the year. CPI-W is used to calculate government transfer payments, such as social security increases.
This report is from the BLS website. These numbers are for CPI-U, whereas the metric used to calculated social security and other government payments is CPI-W.
Last month's CPI report overview is here.
Recent comments