
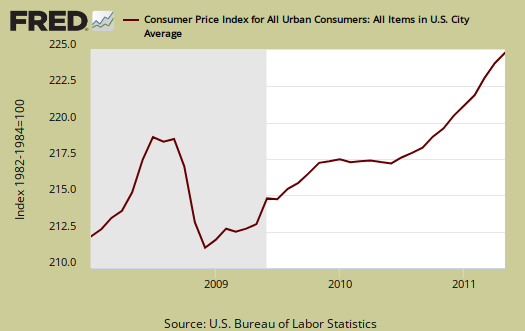
The Consumer Price Index for May 2011 increased 0.2% from last month, but core CPI rose 0.3%, the largest jump since July 2008. Core CPI removes food and energy cost increases and is the number the Federal Reserve watches for inflation. For the year, not seasonally adjusted, the Consumer Price Index for all Urban Consumers (CPI-U) has risen 3.6%. The March CPI monthly increase was 0.4%.
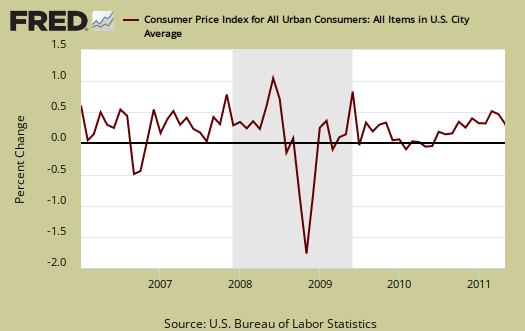
Below is the monthly percentage change in CPI-U, all items.
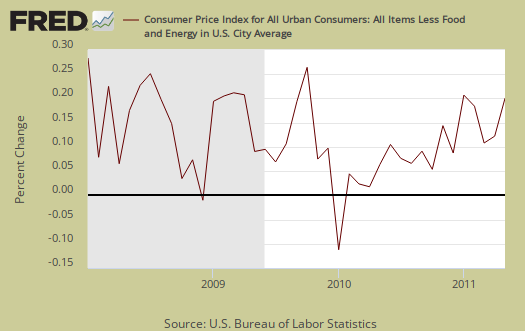
Core CPI, or all items less food and energy, is finally rearing it's ugly head. New and used autos increased 1.1%, apparel increased 1.2%, travel lodging jumped 2.9% and recreation increased 0.3%.
Core CPI's monthly percentage change is graphed below. As we can see, overall, without energy and food, inflation for the first time is showing up.
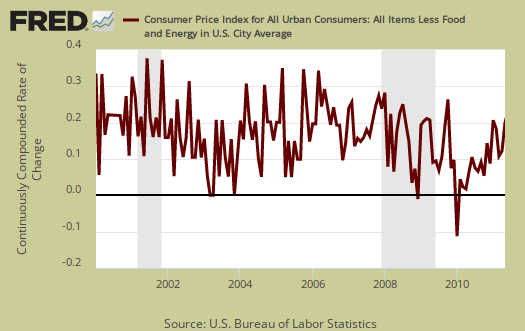
Below is the St. Louis FRED graph to show the overall index on core CPI, or CPI without food and energy included, continuously compounded rate of change Notice how the line is returning to it's rate of change, or slope, after the deceleration in 2008.
Food at home increased, 0.5% from April to May. Food generally increased 0.4% with eating out increasing 0.2%. For the year we have a 3.4% food index increase and if beverages are included, a 3.5% yearly increase. The graph below is food, which includes food at home and restaurants.

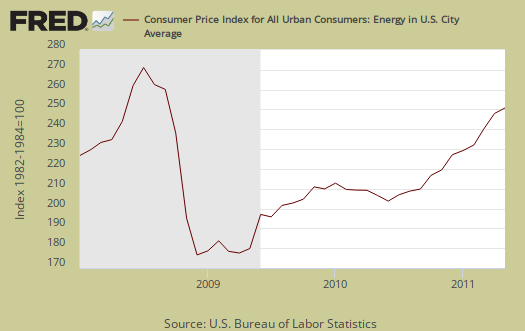
Gas actually dropped -2.0% for May, although is up 36.9% for the year. This is the first decline in 11 months. Fuel oil decreased -0.8% for May but is up an astounding 36% for the year. Natural gas dropped -0.3% this month but is still down -1.2% for the year, but electricity increased 0.8%. Energy overall declined -1% for the month but is still a whopping 21.5% for the year. Below is the CPI-U Energy Index.
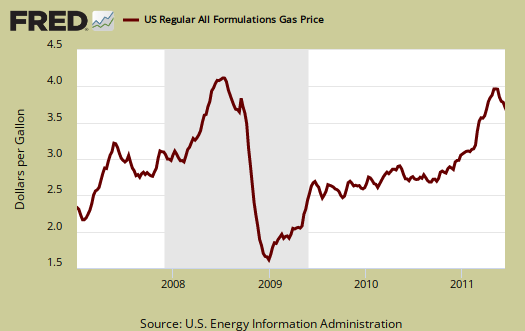
Below are gas prices, last updated May 9th. Notice the oil bubble in early 2008 and notice how close gas prices are now to that previous oil bubble. Sudden spikes in oil are highly correlated with recessions so this month's decline is some good news.
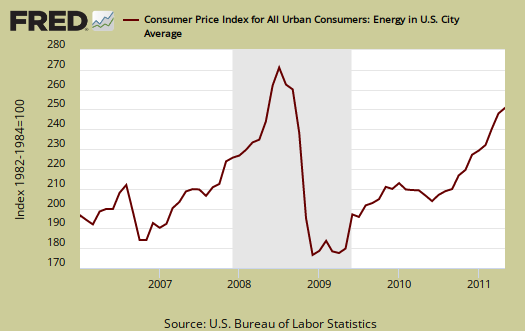
The CPI energy index, capturing the last oil bubble below, is all energy, gas, natural gas, fuel oil and so on. Notice it's dip and return versus the food index as well as how it's not as high, but clearly on the path, as the CPI energy index was during the oil commodities bubble of 2008.
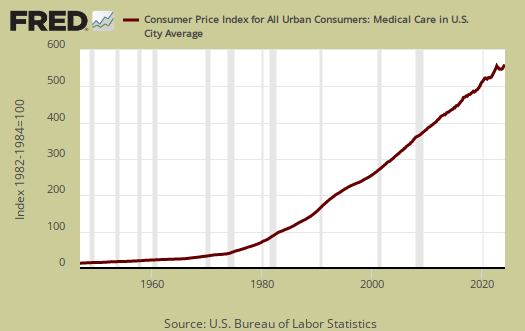
Medical care, as usual, have increased 3% for the year and Medical commodities have increased 3% for the year, but zero for this month. Medical commodities are things like your prescription drugs. Strange isn't it, that Medical care is never mentioned when referring to costs and inflation. It's only as important as food, yet health care is treated almost like it's an extra for daily living.
There has been much criticism as of late that the Federal Reserve only focuses in on core CPI, instead of food and energy. According to the BLS, Food and beverages, which includes food at home, makes up 14.8% of the index. Housing is 41.5% and transportation, including gas for the car, is 17.3%. Medical care is only 6.6%, which frankly, we hope to examine later as not being a reality percentage. All items minus food and energy are considered 77.2% of the total price expenditures for consumers.....according to them.
Regardless, this increase in core CPI will probably get the Fed's attention.
The DOL/BLS does take yearly surveys on where the money goes in the monthly budget, but as one can see, food and energy are significant amounts of the monthly finances. Run away costs in these two areas can break the bank. Considering we have price deflation in housing due to the real estate sector bubble pop, it's strange for food and energy consumer prices to be dismissed when crafting monetary policy.
Guess the concept of not having enough money for gas to get to the job interview never occurred to them.
CPI-W for the month, unadjusted was 222.954, a 0.1% increase from last month and a 4.1% increase for the year. CPI-W is used to calculate government transfer payments, such as social security increases.
Note the the chained CPI-U also increased and this is adjusted for 2005 dollar values was 3.3%, not seasonally adjusted. This means in real dollars, buying stuff plain costs more.
This report is from the BLS website. These numbers are for CPI-U, whereas the metric used to calculated social security and other government payments is CPI-W.
Last month's CPI report overview is here.
Thanks for All these Reports on Reports
It's a huge task to keep up with this stuff and then to try to explain it. Plus you spend hours on preparing your posts and adding the charts.
Thanks for all your efforts. I really appreciate what you do here. Economic Populist is truly a spot of sanity in an ocean of incomplete information, competing misinformation, incompetent commentary and a government that's increasingly blind to our real problems.
Thank the St. Louis Federal Reserve!
The St. Louis Federal Reserve enables me to graph these up fast as hell. If they weren't around, I'd have to maintain a set of graphs that I originally created and hand update them with new data.
I really think, in terms of public tools made available, the St. Louis Fed databases and graphing tools are truly a public service. You'll see all sorts of economists use them, including Paul Krugman, Brad Delong, to explain or at least graph out their points.
To me, reading a table and data entries, to see a pattern in raw numbers is very hard and most people cannot do it.
Graphs give a much better feel for monthly economic reports and for the most part, our "lost decade" or bad economy really is in this data. Pops up plain as day and also dismisses some of the huge lies out their in pundit and corporate lobbyist media plan spin land.
There are some places where I think there is a lot of denial and then in terms of raw data collection, statistics, I think there are still great problems. Some things are not easy to see, such as outsourcing, guest workers, globalization, labor arbitrage and so on, which could be improved by improvements in raw data collection, but for the most part the data really does reflect the sad state of affairs we are in.
Not only does the White House and Congress almost ignore these economic reports, they sure are not proscribing policy, legislation in response. All one needs to do is look at any manufacturing graph for the last 30 years and they should be jumping all over themselves to formulate a national manufacturing policy in response.
So, I think amplifying graphs, data battles the special interests/politicians as well by amplifying how not in reality they are in terms of any policies or legislative agendas!
That drives me nuts for these branches of government were set up so they had a better understanding what was happening on a macro-economic, even international scale.
So, watch out there are GOP, tea parties, politicians who want to privatize or remove these statistical branches of government, believe that or not. They also play with their funding continuously.
Just what we need, even less insight into what's really happening, right?
Playing catch up
I know Blankfein doesn't worry much about inflation, but the rest of us do, because we are playing a game of catch-up, those of us who have jobs or pensions. Somehow, Peter G. Peterson thinks we are to blame for the country's budget woes, and we should take the fall. Yeah, tell it to the Greeks. I keep looking out my window for the crowds carrying pitchforks -- Peter Peterson should do the same. It's too bad Blankfein does not have to speak at town hall meetings across America to crowds of people who have lost their jobs, their retirement, and their homes. For some, Social Security is all they have left and politicians want to tinker with it. At their peril. Inflation + lost hope = Greece. Coming soon to communities near you.
Frank T.