This week's oil data from the US Energy Information Administration showed that our oil inventories fell for the first time in 8 weeks, as our imports of oil also fell to their lowest in 8 weeks, and refiners used more crude than they had in any prior week this year. Wednesday's report showed that our imports of crude oil fell by 494,000 barrels per day to average 7,254,000 barrels per day during the week ending April 1st, down from the average of 7,748,000 barrels per day we were importing during the week ending March 25th. While that was 11.7% less than the 8,217,000 barrels of oil per day we imported during the week ending April 3rd a year ago, oil imports are typically volatile week to week as 2 million barrel VLCC tankers arrive and are offloaded irregularly, so the EIA's weekly Petroleum Status Report (62 pp pdf) reports imports as a 4 week moving average. That metric showed that the 4 week average of our imports was still at the 7.8 million barrel per day level, which was 2.1% above the same four-week period last year.
At the same time, production of crude oil from US wells slipped for the 10th time in the past 11 weeks, as few new wells are being completed to make up for those being depleted. Our field production of crude oil fell by another 14,000 barrels per day, from an average of 9,022,000 barrels per day during the week ending March 25th to an average of 9,008,000 barrels per day during the week ending April 1st. That's now 4.2% below the 9,404,000 barrels per day we were producing during the same week last year, but that nominal 14,000 bpd drop this week obviously had little impact on overall supply when compared to the 494,000 barrel per day drop in imports.
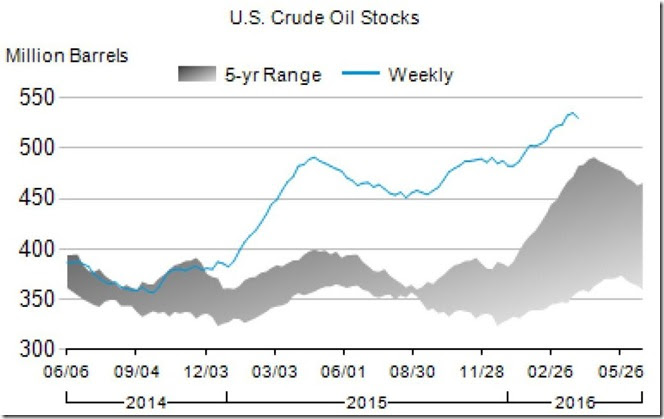
Meanwhile, U.S. refineries’ crude oil inputs averaged 16,433,000 barrels of per day barrels during the week ending April 1st, which was 199,000 barrels per day more than the 16,234,000 barrels of crude per day they processed during the week ending March 25, which itself was 414,000 barrels per day more than they were taking in a week earlier, as the US refinery utilization rate rose to 91.4% during the week from 90.4% of capacity the prior week. That was up 3.1% from the 15,929,000 barrels per day US refineries used during the week ending April 3rd last year, the highest refinery throughput for any week in April in our history, and the only the second time in history that US refiners took in more than 16 million barrels of crude per day in any week in April. So with refineries running at a seasonally record pace, and with our imports of oil down by 1,130,000 barrels per day from the 33 month high hit two weeks ago, oil had to be drawn out of storage to meet the demand, and hence our stocks of crude oil in storage, not counting what's in the government's Strategic Petroleum Reserve, fell by 4,937,000 barrels to end the week at 529,897,000 barrel. Still, that’s more oil than we ever had in storage previously, save for the last two weeks, and despite the drop, our oil inventories are still 9.9% higher than the 482,393,000 barrels we had stored on April 3rd last year, and 38.0% more than the 384,122,000 barrels we had stored on April 4th of 2014. We'll include what is effectively a 7 year graphic of our oil supplies here so you can all see what that drop looks like as it relates to the recent record highs:
In the graph above, copied from page 10 of the EIA's weekly Petroleum Status Report (62 pp pdf), the blue line shows the recent track of US oil inventories over the period from June 2014 to April 1st, 2016, while the grey shaded area represents the range of US oil inventories as reported weekly by the EIA over the prior 5 years for any given time of year, basically showing us the normal range of US oil inventories as they fluctuated from season to season over the 5 years prior to the two years shown by the blue line. We can see that crude oil inventories typically rise in the winter and fall through the summer, but that beginning in early 2015 our inventories topped 400 million barrels for the first time and have only been drawn down modestly since. Note that the increase in the grey wedge on the right now includes the record oil inventories that we were setting last year at this time (ie, it includes the image of the blue line, or the early 2015 record inventories) which we have recently been exceeding by 10% to 20% each week. It's for that reason that we're now comparing current inventories to those of two years ago, when inventories were in a more normal range. Despite the 4,937,000 barrel drop this week, we still have more than 48.8 million more barrels of oil in storage than we had stored just 12 weeks ago...
With more oil being refined this week, our refinery production of gasoline rose for the 1st time in 3 weeks, increasing by 187,000 barrels per day to 9,617,000 barrels per day during week ending April 1st, from our gasoline output of 9,430,000 barrels per day during week ending March 25th. That was 5.2% more than the 9,143,000 barrels of gasoline per day we were producing during the same week last year, and our year to date totals are now running well ahead of last years pace. However, our refinery output of distillate fuels (ie, diesel fuel and heat oil) slipped by 89,000 barrels per day to 4,838,000 barrels per day during week ending April 1st, which put our distillates production 3.2% below the 4,838,000 barrels per day we produced during the same week of 2015...
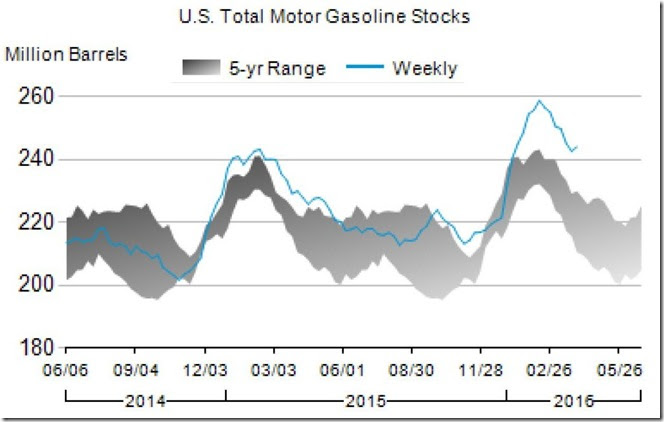
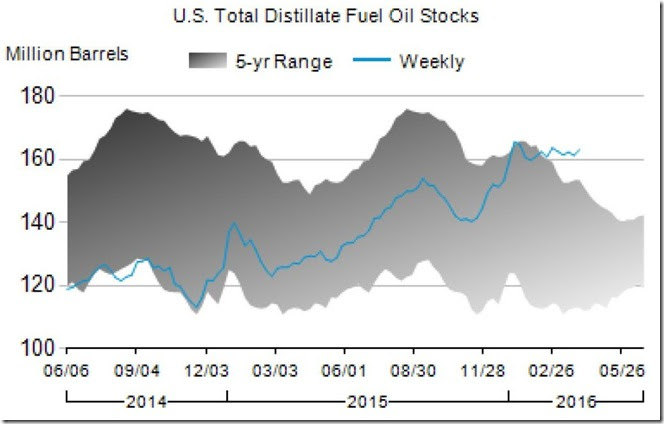
The increase in gasoline production, when combined with a 155,000 barrel per day jump to 617,000 barrels per day in our gasoline imports and a 20,000 barrel per day drop in gasoline consumed to 9,224,000 barrels per day meant that we had a bunch of surplus gasoline left over at the end of the week, and hence our gasoline inventories rose by 1,438,000 barrels, from 242,560,000 barrels last week to 243,998,000 barrels as of April 1st. That was 6.1% more than the 229,945,000 barrels of gasoline we had stored on April 3rd last year, and 15.9% more than the 210,436,000 barrels of gasoline we had stored on April 4th 2014, as the EIA says gasoline inventories are now "well above the upper limit of the average range for this time of year". Our distillate fuel inventories also rose, despite the lower production, increasing by 1,799,000 barrels to 162,984,000 barrels as of April 1st. Those too were "above the upper limit of the average range for this time of year", as distillate inventories are now 28.4% higher than the 126,924,000 barrels we had stored at the same time last year. In order to see what those gasoline and distillate stocks look like compared to recent history, we'll include the graphs for both, taken from pages 12 and 14 of the EIA's weekly Petroleum Status Report (pdf) respectively...
Like the oil inventories graph we included earlier, the blue line above shows the recent track of US gasoline inventories over the period from June 2014 to April 1st, 2016, while the grey shaded area represents the range of US gasoline inventories as reported weekly by the EIA over the prior 5 years for any given time of year, thus showing us the normal range of US gasoline inventories as they fluctuate from season to season, falling during the driving season every summer and rising in winter. Note that gasoline inventories started setting new records late in 2014, and hence the recent inventory records are now well above the records established a year ago for this time of year. Nonetheless, our gasoline stocks are so much above the normal (grey) range right now that the EIA characterizes them as "well above the upper limit of the average range for this time of year"...
Likewise, for the distillate inventories graph below, the blue line shows the recent track of US distillate inventories over the period from June 2014 to April 1st, 2016, while the grey shaded area represents the range of distillate inventories as reported weekly by the EIA over the prior 5 years for the same time of year. Unlike oil and gasoline, however, distillate inventories peak in late summer, and fall through the winter as heat oil is consumed from those supplies. In this graph we can see that up until last summer, distillate inventories had been in the lower half of the average range for time time of year, and even below the average range early in the period. However, with the mild fall and winter, less distillates than normal were used, supplies grew rapidly, and distillate inventories are now too classified as "above the upper limit of the average range for this time of year".
In like manner, our inventories of jet fuel and residual fuel oil are both "well above the upper limit of the average range for this time of year" and our inventories of propane/propylene are "above the upper limit of the average range for this time of year", having stayed above the 5 year average for almost 2 years in a row now. Similar graphs for each of those refinery products can be found on pages 16 to 20 of the EIA's weekly Petroleum Status Report (pdf). The point is that we don't just have a glut of oil in storage, we have a glut of all the major products made from oil. And if we add all those stored products together, which the EIA also does each week, we find our total inventories of oil and oil products rose by 1,130,000 barrels to a new record of 1,357,005,000 barrels this week, up from the total oil & products supplies of 1,355,875,000 barrels that we had stored as of March 25th. And like each of its composite products, that aggregate total is 11.3% higher than the 1,219,347,000 barrels of everything we had stored last April 3rd, and 30.2% higher than the 1,042,458 barrels of oil & products we had stored 2 years ago. Those who’ve been bidding the price of oil up on the report of lower crude inventories didn’t look past the headline to see this larger glut building in the background.
NB: the above was excerpted from my weekly synopsis at Focus on Fracking


Comments
Consumption Calculation
We can derive the total weekly consumption (really daily !) numbers with the standard manufacturing production/inventory formula.
Beginning Inventory 4/8 + Production - Ending Inventory 4/1 = Daily. The EIA overview.pdf contains Total Stocks 4/1 1363.9 + Total Production , a complicated number, of 19,987 and an ending inventory of 1357.0. 1364+19,987 = 19984 thousands BPD Consumed. The street word of 20 million barrels per day is about right. It is the speculative lure of the change in stocks that drive price, not the steady consumption of 20M BPD.
One year ago the same calculation is 1226 -1357 + 18995 = 18864 = thousands BPD Daily Consumption. What a difference in consumption ! Next look at the differences in prices. With significantly lower prices consumption increases in the U.S by 5.5 %
Burton Leed
product supplied
most consider "product supplied" as the equivalent of consumption. EIA publishes that weekly, too:
http://www.eia.gov/dnav/pet/hist/LeafHandler.ashx?n=PET&s=WRPUPUS2&f=W
rjs