
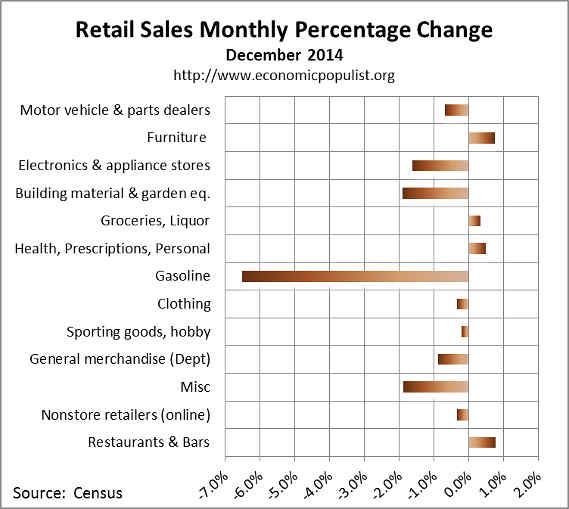
The December 2014 Retail Sales report shows retail sales declined -0.9% for the month. As gasoline prices plunged, sales as gas stations dropped a whopping -6.5%. Holiday sales on the other hand, were up 4.0%. Retail sales have now increased 3.2% from a year ago. December retail sales was not just about gas prices as most categories had monthly declines. Without autos & parts sales, for example, retail sales dropped -1.0%. Retail sales are reported by dollars, not by volume with price changes removed.
Retail trade sales are retail sales minus food and beverage services and these sales declined -1.1% for the month.. Retail trade sales includes gas.
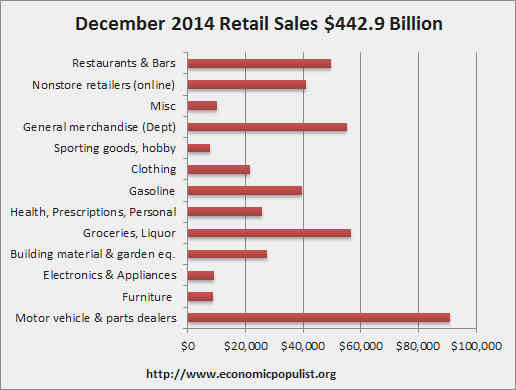
Total retail sales are $442.9 billion for December. Below are the retail sales categories monthly percentage changes. These numbers are seasonally adjusted. General Merchandise includes super centers, Costco and so on.
Below is a graph of just auto sales. Auto sales and parts dropped -0.8% for the month and for autos alone, declined -0.3%. For the year, motor vehicle sales have increased 9.8%. Autos & parts together have increased 8.6%

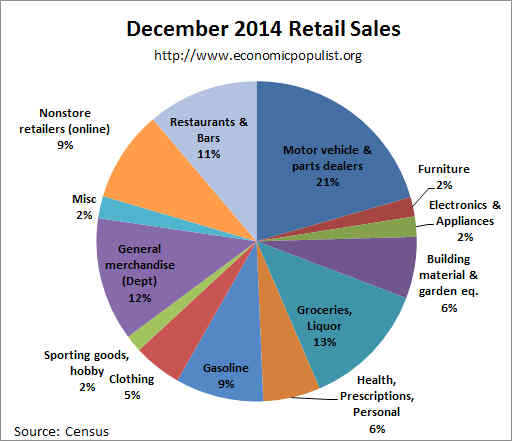
Below are the retail sales categories by dollar amounts. As we can see, autos are by far the largest amount of retail sales. We also see online retailers continue to expand.
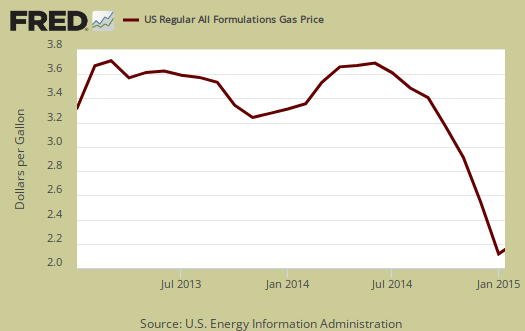
Graphed below are weekly regular gasoline prices, so one can see what happened to gas prices in November. Gasoline station sales are down -14.2% from a year ago.
The below pie chart breaks down the monthly seasonally adjusted retail sales by category as a percentage of total November sales by dollar amounts. One can see how dependent monthly retail sales are on auto sales by this pie chart. We also see non-traditional retailers making strong grounds on traditional general merchandise stores and almost equal to gasoline sales in terms of importance.
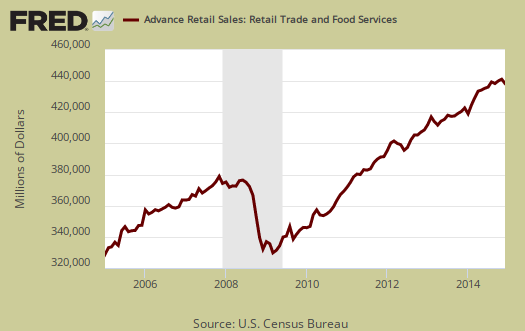
Retail sales correlates to personal consumption, which in turn is about 70% of GDP growth. Yet GDP has inflation removed from it's numbers. This is why Wall Street jumps on these retail sales figures. Below is the graph of retail sales in real dollars, or adjusted for inflation, so one gets a sense of volume versus price increases. Below is the annualized monthly percentage change in real retail sales, monthly, up to October 2014. This is a crude estimate since CPI is used instead of individual category inflation indexes. The below graph can give some insight as to what consumer spending might shape up to be for Q4 2014.

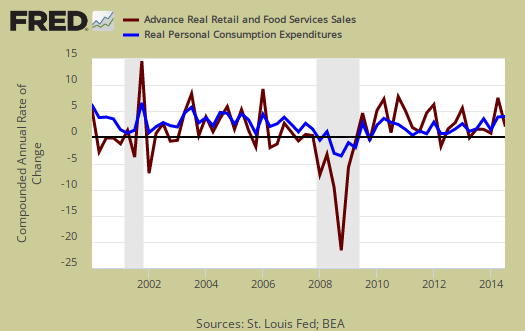
Below is a graph of real PCE against real retail sales, quarterly, up to Q3. See how closely the two track each other? PCE almost looks like a low pass filter, an averaging, removal of "spikes", of real retail sales. Here are our overviews for PCE. Here are our overviews of GDP.
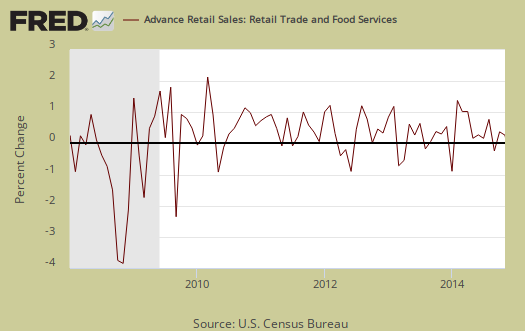
Retail sales are not adjusted for price increases, not reported in real dollars. Real economic growth adjusts for inflation. Retail sales has variance, margins of error, and is often revised as more raw data comes into the U.S. Department of Commerce (Census division). For example, this report has an error margin of ±0.5%. Data is reported via surveys, and is net revenues of retail stores, outlets. Online retail net revenues are asked in a separate survey of large retail companies (big box marts). This is also the advanced report. To keep the monthly nominal percentage changes in perspective, below is the graph of monthly percentage changes of retail sales since 2008.
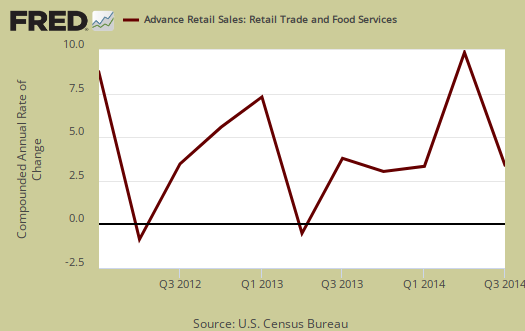
For the three month moving average, from October to December in comparison to the July through September average, retail sales have only increased by 0.4%. Gasoline looks like the culprit still as the bottom has fallen out of prices and . The retail sales three month moving average in comparison to a year ago is up 4.1%. Overall as shown the below graph of quarterly annualized retail sales percentage change, up to Q3 2014. We believe gas prices have much to do with things.
Seasonal adjustments are aggregate and based on events like holidays associated with shopping, i.e. the Christmas rush. Advance reports almost always are revised the next month as more raw sales data is collected by the Census. In other words, do not get married to these figures, they will surely be revised.
Here are past retail sales overviews, unrevised.
New York Times agrees to disagree
One New York Times article (Re: The Fed’s Beige Book Survey) says that: "Reports of rising wage pressures were less prevalent in the latest survey than in its previous report, although there was continued upward pressure for high-skilled labor in such areas as high-tech."
http://www.nytimes.com/2015/01/15/business/economy/feds-beige-book-surve...
That same article also says, "Many private economists believe the big drop in oil prices will provide a boost to the overall economy by giving consumers more money to spend on other products."
But a different New York Times article says: "Americans Pocketing What They Save on Gas, Retail Data Suggests"
http://www.nytimes.com/2015/01/15/business/retail-sales-dropped-more-tha...
revisions to November retail sales
here is a copy of the table from the advance report for November, as reported by Census last month; here's the table from this month, showing the November sales change by business type as revised this week....
the first thing we note is that automotive sales weren't revised much; originally reported as increasing by 1.7%, they're still indicated 1.6% higher...hence, retail sales ex auto took a larger hit, revised from up 0.5% to up just 0.1%...by far the largest factor in that was a revision of November's gas station sales, which were originally reported down 0.8%, and now are seen to have decreased by 3.0%...other business types seeing notable downward revisions include clothing stores, sales of which were reported up 2.2% and are now revised to a 1.2% increase, sales at electronic and appliance stores, which were reported up 0.9% and are now shown as up just 0.1%, November sales at drug stores, originally reported up 0.8%, now revised to a 0.4% increase, and sales at bars and restaurants, which were reported as increasing 0.7% and have now been revised to show a 0.3% increase...in addition, both furniture stores and non-store retailers sales were revised 0.3% lower, while November sales at miscellaneous stores were revised up, from an originally reported decrease of 1.7% to a decrease of just 0.8%...
rjs