
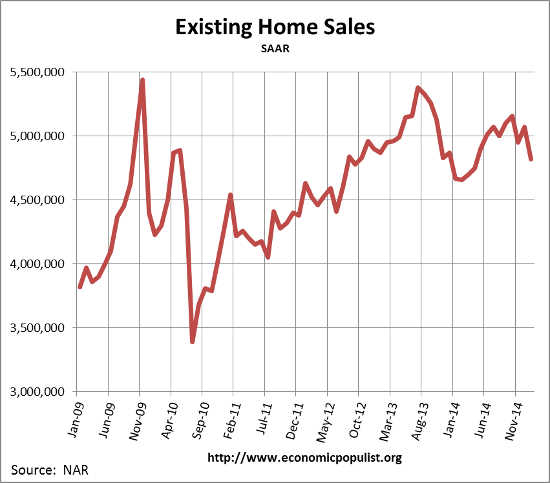
The bitter cold blew in more than snow for January. Existing home sales suffered as well with a -4.9% decline in sales for the month. This is the biggest monthly drop off in nine months with single family homes declining by -5.1% in sales. Sales by volume are now 4.82 million in January. April 2014 showed 4.75 million annualized sales. NAR blames the never ending increasing prices of homes as the culprit for declining sales. Prices are once again back to unaffordable territory.
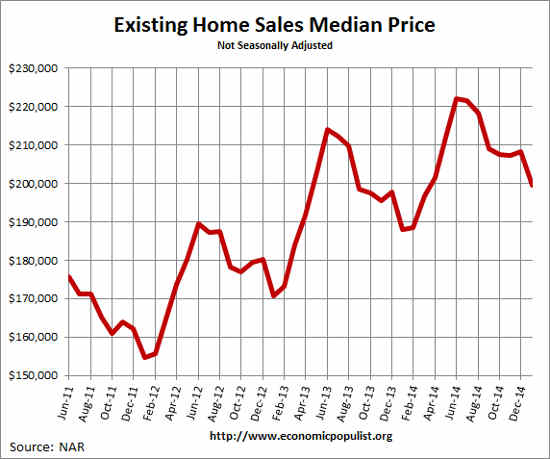
The national median existing home sales price, all types, is $199,600, a 6.2% increase from a year ago. This is the 35th month prices have increased and NAR uses the word soar to describe existing home prices. The average existing sales price for homes in January was $248,100, a 4.9% increase from a year ago. Below is a graph of the median price.
Distressed home sales have really declined in the last year, -14% and are now only 11% of all sales. Foreclosures were 8% while short sales were 3% of all sales. The discount breakdown was 15% for foreclosures and short sales were a 12% price break.
So called investors were 17% of all sales and 67% of these investors paid cash. A year ago investors were 20% of all sales. All cash buyers were 27% of all sales. First time home buyers were 28% of the sales, a low not seen since June 2014.
The median time for a home to be on the market was 68 days. Short sales by themselves took 128 days. Housing inventory from a year ago has decreased -0.5% but unsold inventory is up 0.5% from the previous month. Current the 1.88 million homes available for sale are a 4.7 months supply.
On a separate note, RealtyTrac reported January foreclosures increased by 5% for the month and are down 4% for the year. RealtyTrac reports 933,043 properties are in the foreclosure process or already bank owned. It's fairly obvious the great bargain hunt from the housing bubble collapse is over as cheap properties have simply dried up. Now the issue is the very tight lending standards so new home buyers cannot get into a home, plus the over inflated prices. This quote from the NAR stood out and lord help you if you are self-employed trying to get a mortgage:
The Federal Housing Administration’s overly restrictive approval process limits buyers’ access to condos...NAR has urged the FHA to develop policies that will give buyers access to more flexible and affordable financing opportunities and a wider choice of approved condo developments.
Below is NAR's breakdown by existing home sales type and regions. The west has the most unaffordable housing consistently.
January existing-home sales in the Northeast fell 6.0 percent to an annual rate of 630,000, but are 3.3 percent above a year ago. The median price in the Northeast was $247,800, which is 2.7 percent above a year ago. In the Midwest, existing-home sales declined 2.7 percent to an annual level of 1.08 million in January, but are still 0.9 percent above January 2014. The median price in the Midwest was $151,300, up 8.2 percent from a year ago. Existing-home sales in the South decreased 4.6 percent to an annual rate of 2.07 million in January, but are still 5.6 percent above January 2014. The median price in the South was $171,900, up 7.4 percent from a year ago. Existing-home sales in the West dropped 7.1 percent to an annual rate of 1.04 million in January, but are still 1.0 percent above a year ago. The median price in the West was $291,800, which is 7.2 percent above January 2014.
Here are our past overviews of existing home sales not revised.
Recent comments