
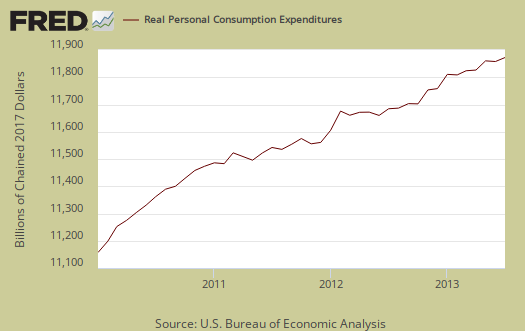
The July personal income and outlays report shows no change in real consumer spending, which is really bad news for GDP. Not adjusted for inflation consumer spending rose a scant 0.1%. Real personal income isn't any better with no change for the month. Personal income not adjusted for inflation rose 0.1%. Once again we see America tapped out, not increasing their spending which fuels America's economic growth.
Consumer spending is another term for personal consumption expenditures or PCE. Real personal consumption expenditures were $10,709.6 billion for July. Real GDP was $15,681.0 billion so we can see consumer spending is about 68% of GDP. Real means adjusted for inflation and is called in chained 2009 dollars
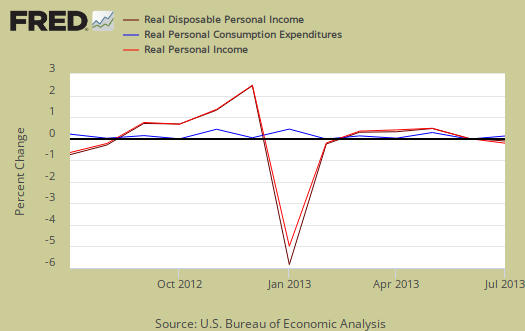
Disposable income is what is left over after taxes and increased 0.1% when adjusted for prices. Graphed below are the monthly percentage changes for real personal income (bright red), real disposable income (maroon) and real consumer spending (blue).
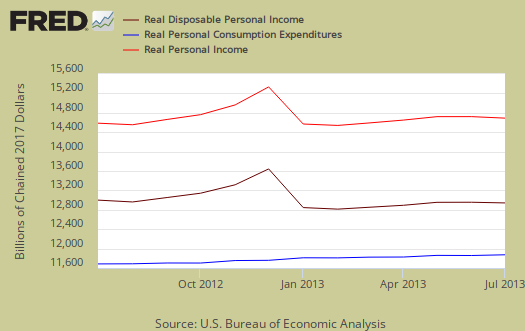
Below are the real dollar amounts for real personal income (bright red), real disposable income (maroon) and real consumer spending (blue) for the last year.
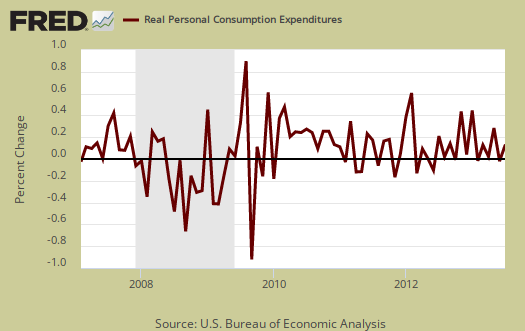
Consumer spending encompasses things like housing, health care, food and gas in addition to cars and smartphones. In other words, most of PCE is most about paying for basic living necessities. Graphed below is the overall real PCE monthly percentage change so one can see, a zero monthly percentage change isn't that unusual although overall economic growth as been anemic.
For July people spent money on nondurable goods. These are things like gasoline and food. Health care, for example, is a service. Cars are a durable good. When people are cutting back on their spending, durable goods are usually the first things to go, especially large ticket items. Below are the real monthly percentage changes.
- Durable goods: +0.1%
- Nondurable goods: +0.5%
- Services: -0.1%
Price indexes are used as divisors to adjust for inflation and price changes. The indexes are used to compute spending and income for an apples to apples, real dollar comparison to previous months and years. Economic statisticians use real dollars so one does not erroneously assume economic growth when the increase is really just inflation. The PCE price index is also a Federal Reserve inflation watch number. Believe it or not, deflation is bad juju for economic growth and we have price increases below the Fed's target rate. The PCE price index is used to remove inflation from consumer spending and income, reported above as real, or in chained 2009 dollars
The price index increased 0.1%, for July and this is a low figure. The price index is now up 1.4% from a year ago. Minus energy and food, the price index increased 0.1 from last month and is up 1.2% from this time last year, below the Fed's 2.0% target rate. While the PCE price index represents inflation, it is different from CPI.
Graphed below is the PCE price index, in red, scale on the left, and the PCE price index minus food and energy in blue, scale on the right. This is the percent change from one year ago. We are seeing low inflation similar to the deflationary period of 2008, caused in part by the Great recession and a massive drop in global economic demand. For those watching quantative easing, you might take a look at this article on the Fed's concern for potential deflation.

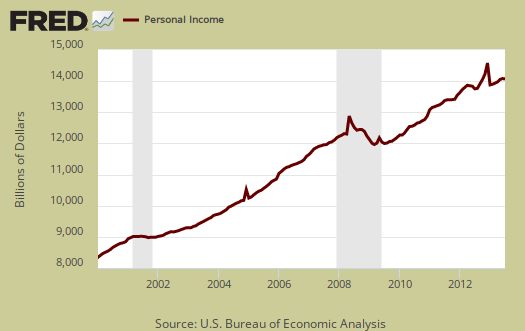
Personal income is total income, from all sources, for everybody in the United States who reported and are not part of the underground economy. Below is personal income, not adjusted for inflation, or price changes.
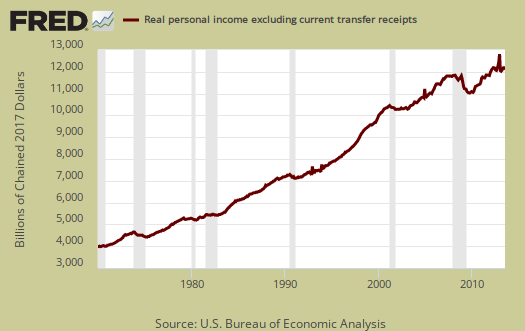
The BEA reports real personal income as real personal income minus transfer receipts. This is government payments, such as social security, removed and also adjusted for inflation. Here too we see no change for the month. This graph shows how much personal income increased that wasn't funded by the government and is used as a recession indicator as show in the below graph with the gray bars indicating recessions. Transfer receipts are payments from the government to individuals where no actual services (work) was performed. This includes social security, unemployment insurance, welfare, veterans benefits, Medicaid, Medicare and so on.
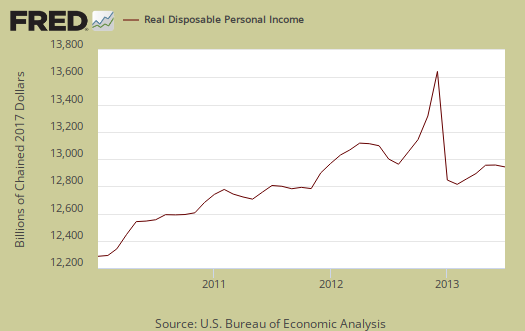
Disposable income is what is left over after taxes. DPI increased 0.2% from last month. DPI adjusted for inflation (see the price indexes above), increased 0.1%, from the previous month. These numbers are aggregates, which includes income of the uber-rich, or the 1% of the population, as they are now called. Below is DPI by levels.
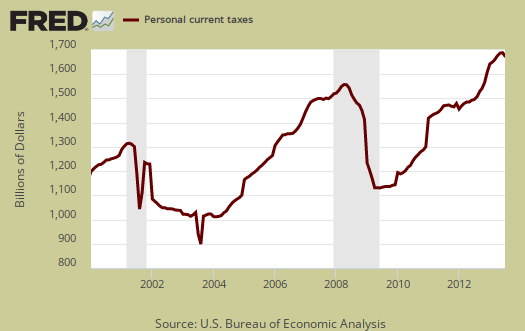
Taxes collected on person income decreased -0.5% from last month. This is the only reason disposable income increased shown above. Below is a graph of personal income taxes where one can also see the effect of the Bush tax cuts as well as the recession (no income, no taxes on that income), as well as the temporary tax breaks from the Stimulus.
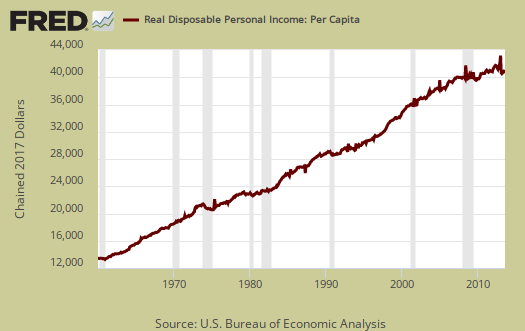
Graphed below is real disposable income per capita. Per capita means evenly distributed per person and population increases every month. While income in the U.S. grows so does the population which earns that total pot of income. July mid-month the U.S. population was 316,600,000. What we see when taking increased population into account, we basically have no growth in real disposable personal income and this is over years. Notice how real disposable income per person really started to flatline in 2000. That's just when offshore outsourcing to China started in earnest. The great recession has made the situation even worse.
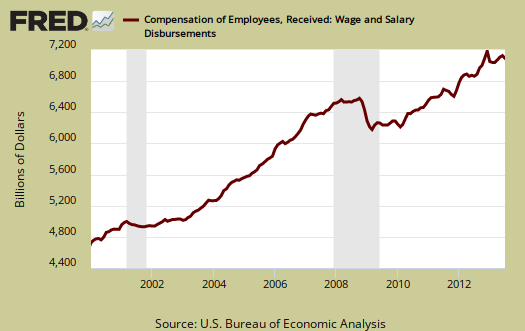
Wages and Salaries also took a hit in July and dive bombed by –0.3% from June. Overall employment compensation declined by -0.2%. Yet lord protect investors as dividends increased 2.2% for the month. Assets are Wall Street income, which most of America doesn't have of which dividends are a part and overall increased 0.7% Rental income increased 1.3% for the month. n other words, workers got nothing and the rich showed more income gains. Graphed below are wages and salaries for the past decade. Notice the dip and the more flat line than earlier in the decade. Bear in mind these are aggregate, or all wages and salaries, and not adjusted for inflation. Don't blame the government sequester for this drop either. While government wages were lower, so were all wages. From the report:
Private wages and salaries decreased $15.3 billion in July. Goods-producing industries' payrolls decreased $4.2 billion, manufacturing payrolls decreased $3.7 billion. Services-producing industries' payrolls decreased $11.2 billion. Government wages and salaries decreased $6.4 billion in July. Government wages were reduced by $7.7 billion in July due to furloughs that impacted several federal government agencies.
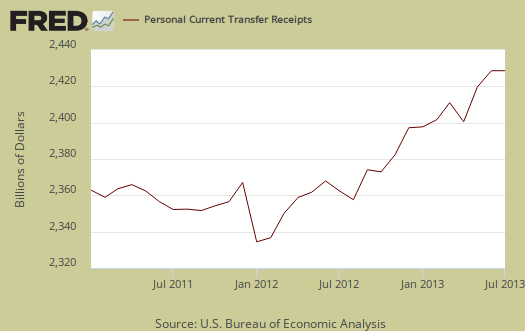
Transfer receipts, which are things like social security increased 0.2%, not adjusted for inflation. Below is a graph of just transfer receipts.
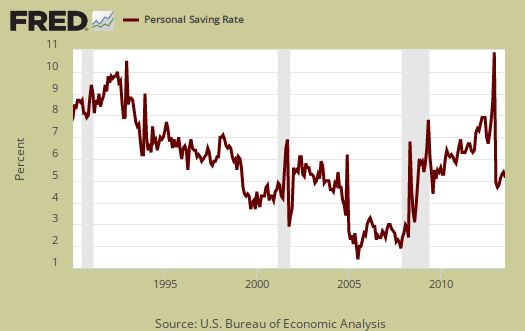
Personal savings is disposable income minus outlays, or consumption and not adjusted for inflation. The Personal Savings Rate was 4.4%.
To visualize more data from this report, consider playing around with more of the St. Louis Federal Reserve Fred graphs. Here are our overviews of personal income & outlays and overviews of GDP are here. This overview details the BEA Personal Income and Outlays statical release, which covers individual income, consumption and savings. The personal income & outlays report is annualized and seasonally adjusted, although most percentages are presented as monthly rates.
Recent comments