
My buddy Bonddad occasionally posts items invariably entitled, We're Nowhere near a Bottom in Housing. I agree with that, but there are signs that change is afoot.
As I have previously described, Prof. Edward Leamer has studied all of the post WW2 recessions, and has noted that society needs only so many new houses and vehicles in any given year. Expansions typically end at a point where there has been overproduction of both. The recession ends and the next expansion begins only after that excess has been sopped up by a long and/or deep enough period of underproduction. Needless to say, there was wild overbuilding of houses in the first part of this decade. In fact, the graphs which appear below suggest overbuilding began ever so slightly over 10 years ago.
Due to the massive overbuilding, the housing bubble is correcting via a market crash. Russ Winter has aptly described market crashes as typically consisting of two parts -- "guillotine" and "sandpaper" -- by which he means that there is an initial near vertical decline (the guillotine) followed by a long, grinding slow further decline (the sandpaper). Here's an example (Japan's stock market crash) pulled from his blog:
In the case of the housing market crash, how would the change from "guillotine" to "sandpaper" look? In the past, Calculated Risk has reckoned that the inflection point between advancing and declining house prices was at about 7 months' supply. So I submit that first of all, we would see a decline in months' supply of houses for sale towards that mark, as sales started to outstrip new house starts and existing homes being offered for sale. In order to accomplish that, you would first need to see that new home building has declined to a level where sales exceed new starts. You would also want to see existing home sales increasing on a year-over-year basis. In other words, the volume of new home starts would transition from guillotine to sandpaper first, well before prices themselves would begin the transition.
And Guess what? All of those conditions have either started or appear to be on the cusp of starting.
Turning first to new home sales, in the first graph below (courtesy of Mike Larson) I have overlayed in the yellow line the trend of new home sales, showing just how great the excess of the first part of this decade was. To return to Prof. Leamer's point, only when the area OVER the line, representing volume of the previous housing bubble, is followed by an equal area representing subsequent underproduction, will the bust end and the equilibrium point be reached again:
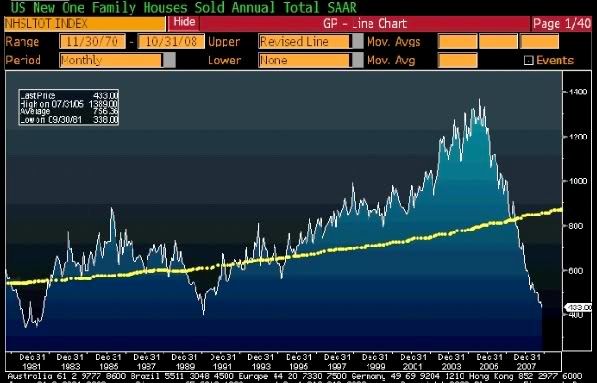
Just by eyeballing the graph, it looks like we are about half the way there. The remaining area can be made up by further declines in volume, or longer time at existing volumes, or some combination of both. The graph suggests that, at least in terms of VOLUME, the decline in new home sales might not have that much further to go.
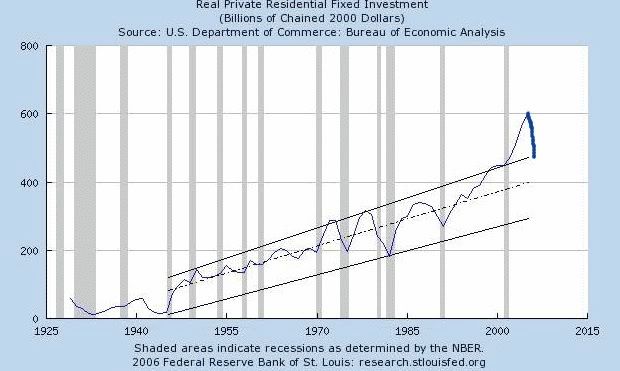
A second graph comes from Mark Thornton. This graph, with data only through the end of 2005, shows the long term trend of real investment in private structures. Each area above the dotted line showing the median trend, is balanced by an area below the line, until about 1995, exactly as shown in the first graph above. The trend line is completely blown by the bubble of earlier this decade. In this graph I have drawn in the most recent data, which only dates from 2007. Undoubtedly now at the end of 2008 the real investment in private structures has plummeted below the dotted median trend line. It does not have too much further to fall to its long term bottom trend line:
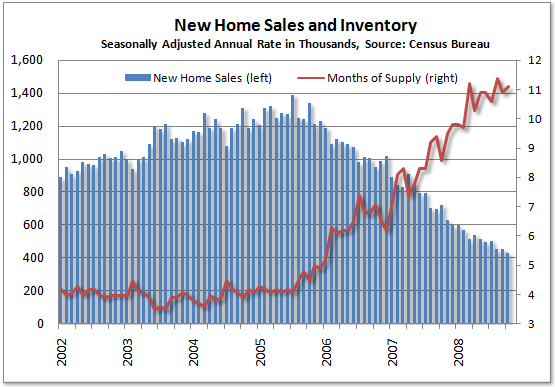
Our third graph (courtesy of Calculated Risk), shows new home sales and months of inventory through October of this year. As CR himself notes, builders have cut back so drastically that inventory (the red line) has been in decline for over a year:
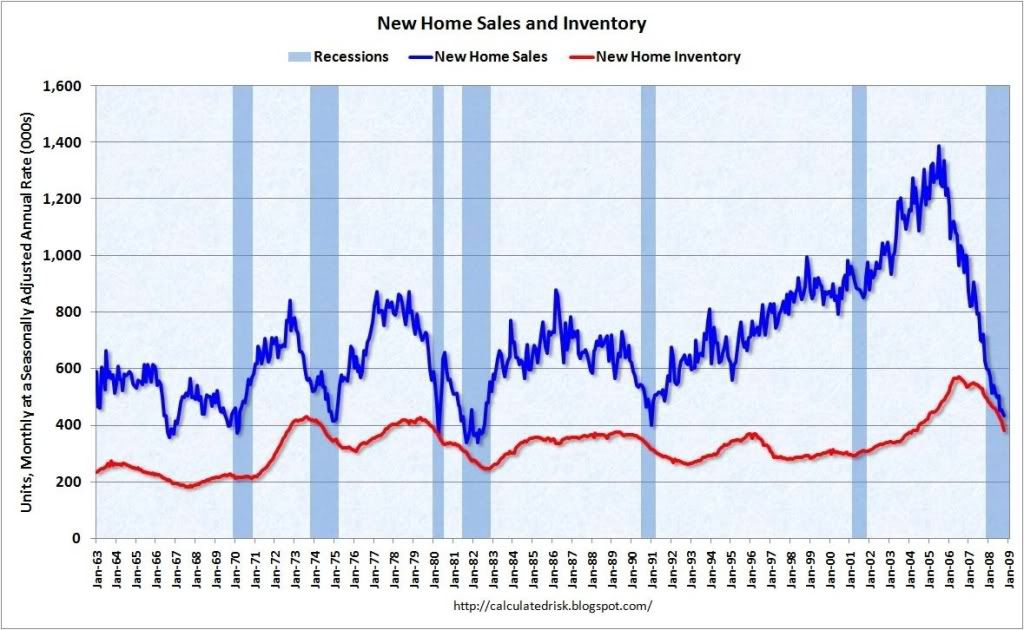
Another look at the same data by Tim Iacono that shows months of new home inventory indicates that months of supply may be on the verge of peaking:
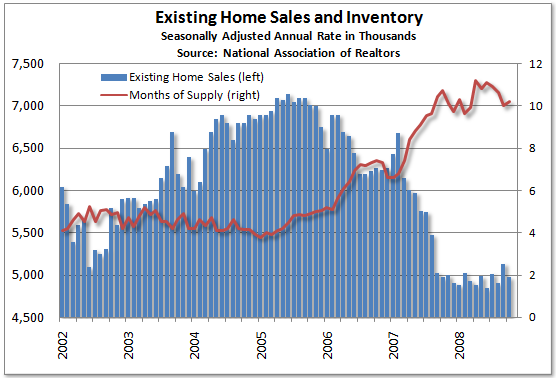
Turning to the much larger market for existing homes, the most recent data (also courtsey of Calculated Risk) shows that for the first time since 2005, in both September and October 2008 sales exceeded 2007 sales:

And Tim Iacono's graph of the same data shows that the number of existing homes sold per month is stabilizing, as is the months' supply of inventory:
At some point, inevitably the housing bust will come to an end. If we are at the beginning of the transition from the guillotine phase to the sandpaper phase, with volume preceding price, which is what the above data suggests, then at least in terms of volume -- but not price -- the bottom may come as early as next year (even though prices themselves would still be "nowhere near bottom").
But,whenever that happens, an increase of the volume of construction from even a very depressed level means that additional jobs would be created, and more business would be transacted than at the bottom, even if prices are still declining. In other words, the basis for beginning of some sort of economic expansion. It may be a journey of 1000 miles, but progress towards the end of the housing bust has taken its first step.
Comments
Housing bottom
How will next peak wave of recasts/resets affect housing market? Skyrocketing unemployment? Is it likely these factors create another plunge in sales and rise in inventory?
same question here
I'm looking at this ARM reset schedule specifically:
Arm Reset Schedule (click to enlarge)
The second round of resets
I don't have the cite handy, but I have read in various places that the second round of resets has been to a large extent reduced. Both the borrowers and the lenders, mindful of the first wave, have taken action to recast mortgages in the second wave.
Additionally, with the Fed taking aggressive action re long-maturity bonds, mortgage rates have declined significantly -- so the resets will be to lower rates.
I agree that the biggest danger to this forecast is the plunge in consumer spending and jobs in the last 3 months.
interesting work....
but I could use the same graphs to show that "months of supply" and "Real Private Investment" (even adjusted to your expectations) still have a ways to go to reach bottom. Combine that with a whopper of a recession and an over correction is hardly unlikely.
FWIW - I was at a conference
FWIW - I was at a conference with Leamer in June and he was confident that we'll avoid a recession - we learned on Monday that we were seven months into one at the time.
I concur with your overall assessment - I think the smart money sees home prices bottoming in 2010.
BTW - please consider dialing back the difficulty on the CAPTCHA comment verification - it is ridiculously hard.
What about foreclosures
I think there is a third prerequisite in addition to the 2 you mention above. Existing home sales increasing year over year is not enough. You also need to see a reduction in the overall mortgage delinquency rates which will lead to a decline in the additional housing supply created by the foreclosure process. Defaults are expected to increase throughout 2009 as option arm loans recast. Rising unemployment will not help delinquency rates either. A reduction in new home oversupply will surely be helpful, but we also need a reduction in the supply of existing homes that is created by the foreclosure process.
Your CAPTCHA is very difficult for me (a human) to decipher.
Hello New People, Welcome to EP and How to Avoid CAPTCHA
Howdy! If you register on the right and log on, all CAPTCHA goes away, comments are immediately posted and a host of features are available.
CAPTCHA is having to read in funky letters in a box to prove you are not a spammer but is only present for unregistered users who go into a moderation queue.
Existing vs. new houses and volume
The sale of an existing home does not create new jobs etc. because it does not produce new housing stock.
So I agree with you, but at the same time the foreclosure issue doesn't seem so relevant to the volume of new home sales, which is probably the first thing that is going to bottom in the housing bust.
Housing bust will come to an end
When average housing prices hit 3x poverty level. Not before.
At the rate we're going, that'll be when you can get a 2 bedroom 1 bath ranch for $60,000.
-------------------------------------
Maximum jobs, not maximum profits.
Agreed
I hope my thesis in this diary is clear. There will be a bottom in volume before there is a bottom in price (probably by a substantial period of time). There is some evidence that volume is beginning to fall at a lesser rate.
In terms of price, Housing is Nowhere Near a Bottom.