
The Federal Reserve Industrial Production & Capacity Utilization report shows industrial production soared by 0.6% as manufacturing came alive with a 0.8% increase. This is the largest gain since November 2014. The reason for the surge was autos. Motor vehicles and parts manufacturing jumped up 10.6% in a month. The G.17 industrial production statistical release is also known as output for factories and mines.
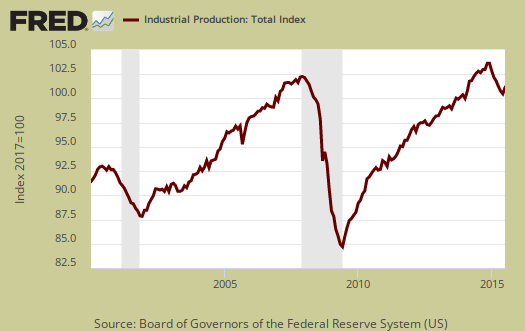
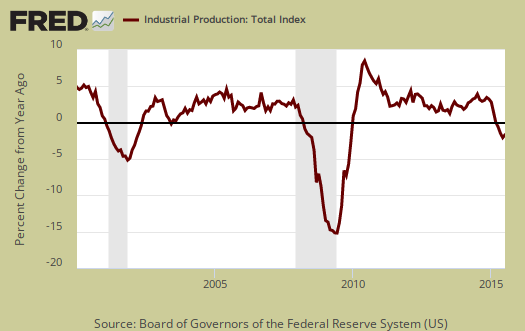
Total industrial production has now increased 1.3% from a year ago. Currently industrial production is 7.5 percentage points above the 2012 average. Below is graph of overall industrial production's percent change from a year ago.
Here are the major industry groups industrial production percentage changes from a year ago.
- Manufacturing: +1.5%
- Mining: -2.0%
- Utilities: +4.6%
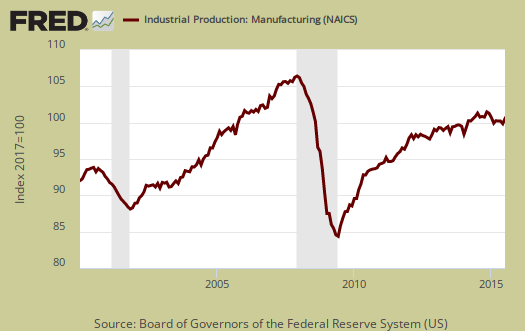
For the month manufacturing overall increased 0.8%. Manufacturing output is 5.7 percentage points above it's 2012 Levels and is shown in the below graph.
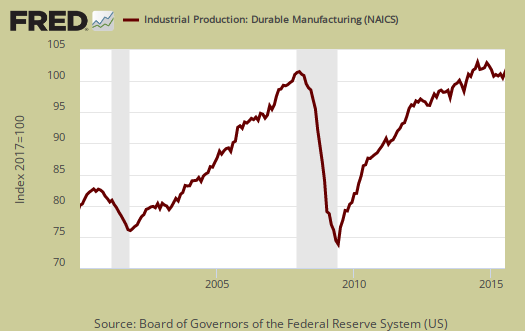
Within manufacturing, durable goods increased 1.2% for the month and 1.5% for the year. While Motor vehicles & parts increased a whopping 10.6%, Machinery decreased -1.3%.
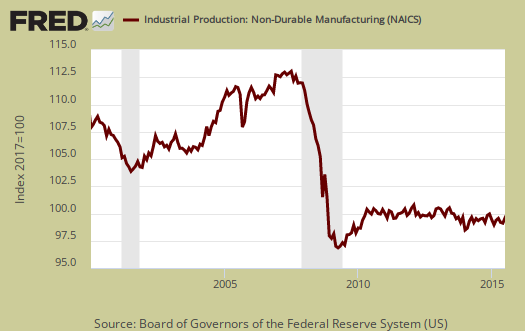
Nondurable goods manufacturing increased by 0.4% for the month and has increased 2.0% over the year. Petroleum showed a -0.9% drop.
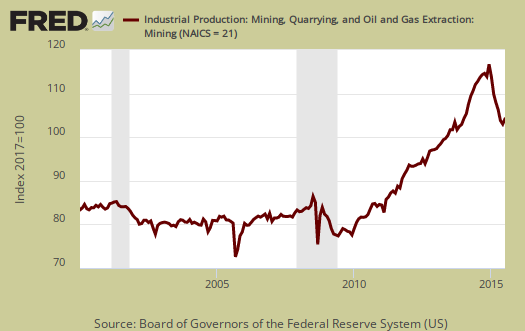
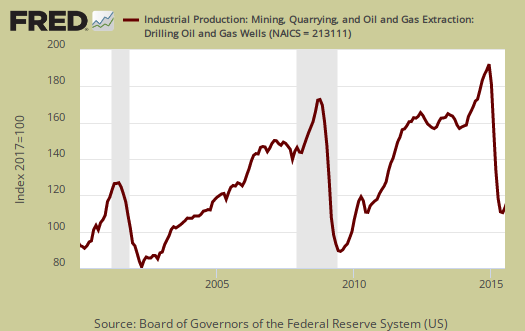
Mining increased 0.2% and is now down -2.0% for the year. Mining includes gas and electricity production and the Fed have a special aggregate index for oil and gas well drilling. Oil and gas well drilling increased 1.3% and for the year is down -53.2%, an astounding collapse.
Below is oil and gas well drilling and one can see the boom and bust cycle.
Utilities decreased by -1.0% for the month and is up 4.6% for the year. Utilities are volatile due to weather and why the below graph shows the wild swings.

There are two reporting methodologies in the industrial production statistical release, market groups and industry groups. Market groups is output bundled together by market categories, such as business equipment or consumer goods and shown below:
Most major market groups recorded gains in July. The largest increase was in the output of consumer goods, which rose 1.2 percent. This gain was largely attributable to an increase of 10.9 percent in the production of automotive products. Among the remaining categories of consumer goods, non-energy nondurables registered a small gain after decreasing in the previous two months, while energy products posted a loss of 1.3 percent. The index for business equipment edged up, as an increase of 3.5 percent for transit equipment was mostly offset by a decrease of 1.5 percent for industrial and other equipment; the production of information processing equipment was little changed. The output of business supplies moved down 0.2 percent, and the production of construction supplies moved up a similar amount for its fourth consecutive monthly gain. The index for materials rose 0.6 percent, with increases of 1.6 percent and 0.4 percent for durable and nondurable materials, respectively, and a decrease of 0.4 percent for energy materials.
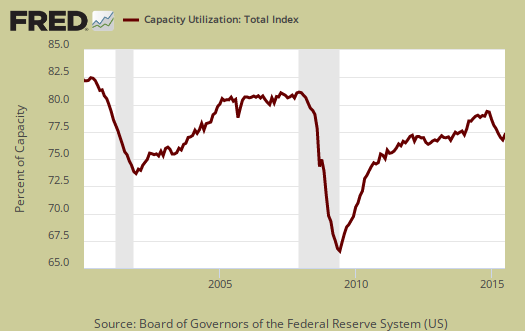
Capacity utilization, or of raw capacity, how much is being used, for total industry is 780%, an increase of 0.3 percentage points from last month. . Capacity utilization has decreased by -0.3 percentage points from a year ago and is 2.1 percentage points below the long run average. This is a pretty horrific trend that didn't change with the July revisions. Manufacturing capacity utilization increased 0.4 percentage points for the month, is 76.2% and is 2.3 percentage points below it's long run average. Within manufacturing, durable goods capacity utilization increased 0.8 percentage points for the month and is down by -0.3 percentage points below the long term average Mining capacity utilization is 84.4%. Utilities use of it's capacity is 79.9% and has decreased b -0.8 percentage points for the month.
Capacity utilization is how much can we make vs. how much are we currently using, of what capacity is available now, or output rate. Capacity utilization is also called the operating rate. Capacity utilization is industrial production divided by raw capacity.
Capacity growth is raw capacity and not to be confused what what is being utilized. Instead, this is the actual growth or potential to produce. Capacity is the overall level of plants, production facilities, and ability to make stuff, that we currently have in the United States. Capacity growth overall has increased 1.7 percentage points from a year ago. Below is the capacity growth increase from a year ago of the subcategories which make up industrial production.
- Manufacturing: +1.0%
- Mining: +6.0%
- Utilities: +1.0%
Below is the Manufacturing capacity utilization graph, normalized to 2007 raw capacity levels, going back to the 1990's. One can see offshore outsourcing as the slope decreases. Pay particular attention to the 2001-2003 as manufacturing had a mass exodus to China after passage of the bad trade deal in 2000.
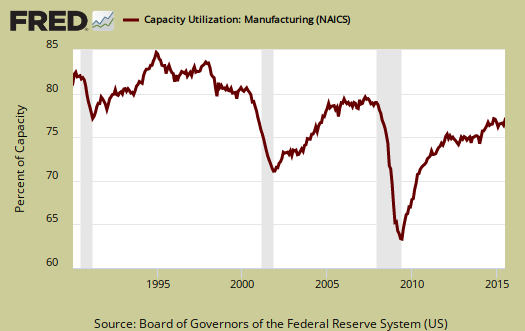
This report is great, yet for how long can one rely on the auto industry having a good month? The thing most disturbing is how raw capacity is now 138.8% of the 2012 levels, yet manufacturing capacity utilization is still below the long run average.
Here are our previous overviews, only graphs revised. The Federal Reserve releases detailed tables for more data, metrics not mentioned in this overview.
...like Trump said:
Reuters: Ford plans $2.5 billion investment in Mexico
Ford will invest $1.3 billion to expand its plant in northern Chihuahua state, where it will build two new diesel engines, with another $1.2 billion planned for a transmission plant in central Guanajuato state.
http://www.reuters.com/article/2015/04/14/us-mexico-autos-ford-motor-idU...