
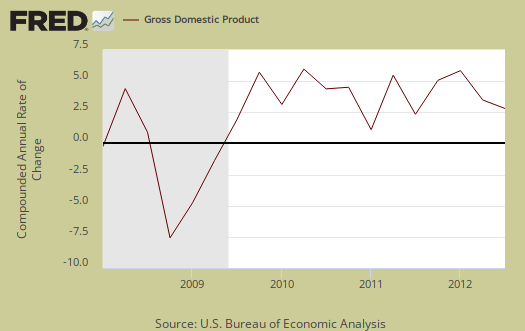
Q3 2012 real GDP shows 2.0% annualized growth in the advance report, reflecting a very sluggish economy. Q2 GDP was 1.25%.
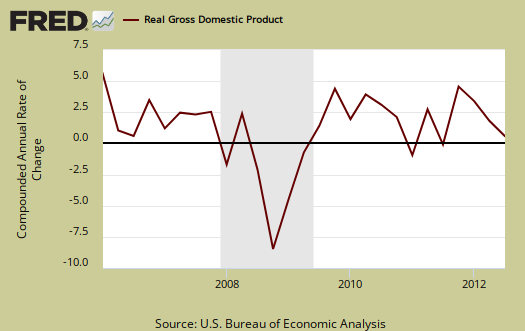
A quarterly GDP of 2.01%, unrounded, is not robust growth. Consumer spending did pick up from Q2, but exports declined. Government spending alone attributed for 0.71 percentage points of Q3's 2.01% GDP. The drought negatively impacted economic growth as farm inventories reduced GDP by –0.42 percentage points.
As a reminder, GDP is made up of: where Y=GDP, C=Consumption, I=Investment, G=Government Spending, (X-M)=Net Exports, X=Exports, M=Imports*.
The below table shows the percentage point spread breakdown from Q2 to Q3 GDP major components. GDP percentage point component contributions are calculated individually and why Q2 GDP is off by 0.01 percentage point from the actual annualized percentage change.
| Comparison of Q3 2012 and Q2 2012 GDP Components | |||
|---|---|---|---|
|
Component |
Q3 2012 |
Q2 2012 |
Spread |
| GDP | +2.01 | +1.24 | +0.77 |
| C | +1.42 | +1.06 | +0.36 |
| I | +0.07 | +0.09 | -0.02 |
| G | +0.71 | –0.14 | +0.85 |
| X | –0.23 | +0.72 | -0.95 |
| M | +0.04 | –0.49 | +0.53 |
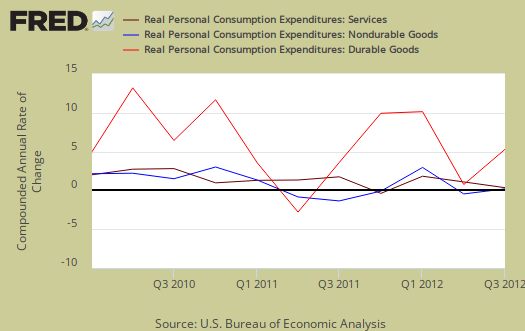
Consumer spending, C in our GDP equation, improved from the 2nd quarter with durable goods contributing 0.63 percentage points to personal consumption expenditures. Motor vehicles & parts alone had a 0.18 percentage point contribution to durable goods spending whereas Q2 showed a -0.26 percentage point contribution. Graphed below is PCE with the quarterly annualized percentage change breakdown of durable goods (red or bright red), nondurable goods (blue) versus services (maroon).
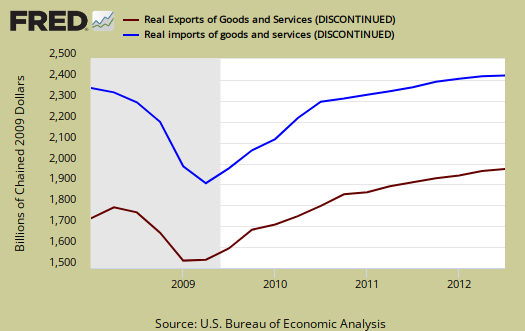
Imports and exports, M & X are greatly impacted by real values and adjustments for prices from overseas and they are usually revised. The below graph shows real imports vs. exports in billions. The break down of the GDP percentage change to point contributions gives a clear picture on how much the trade deficit stunts U.S. economic growth. We see a slowing of global trade generally with exports' decline negatively impacting GDP by -0.23 percentage points while the slow down in imports only giving a 0.04 percentage point boost to Q3 GDP.
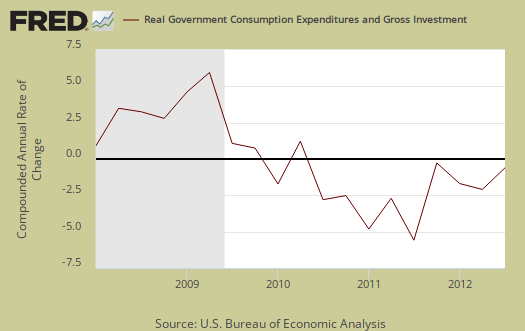
Government spending, G was 0.71 percentage points or 35.3% of Q3's GDP growth. This was all federal spending, and of that Federal 0.72 percentage point GDP contribution, 0.64 of it was national defense. State and local governments subtracted -0.01 percentage points from Q3 GDP. Below is the percentage quarterly change of government spending, adjusted for prices, annualized.
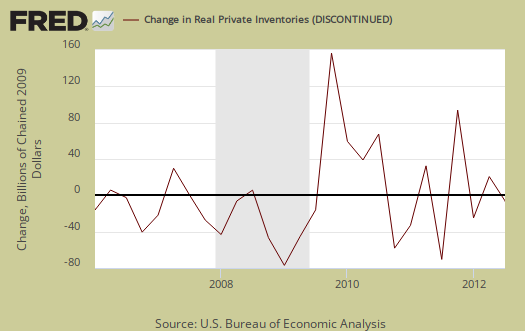
Investment, I is made up of fixed investment and changes to private inventories. The change in private inventories alone gave a –0.12 percentage point contribution to Q3 GDP. Below are the change in real private inventories and the next graph is the change in that value from the previous quarter.
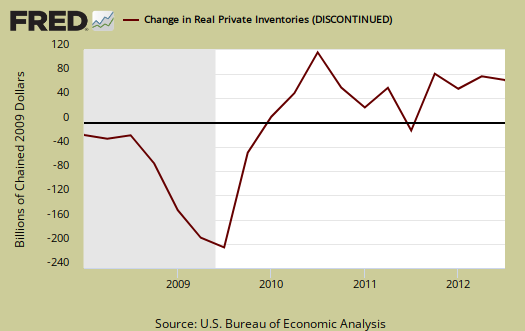
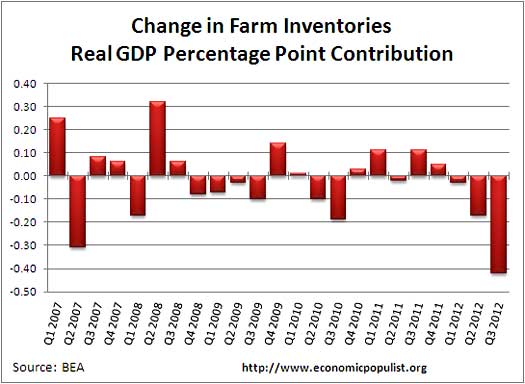
The reason the changes in private inventories subtracted from GDP were farms. The drought is causing farms to reduce their livestock and crop yields are way down. While nonfarm inventory level changes contributed 0.30 percentage points to GDP, farm inventories reduced GDP by -0.42 percentage points, or `17.3%.
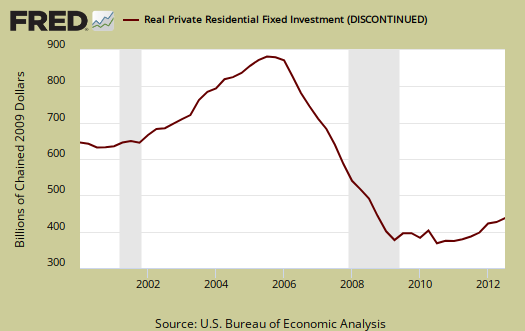
Residential fixed investment was +0.33 percentage point contribution to Q3 GDP. One can see the housing bubble collapse in the below graph and also how there is no meteoric recovery for Q3, in spite of all of the housing data hype. What's happening is there is activity in residential real estate but by volume will not return to the housing bubble years.
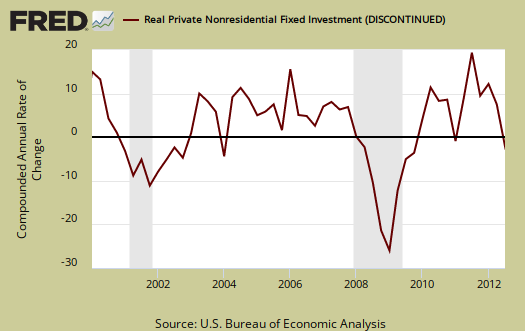
Nonresidential fixed investment was a –0.13 percentage point contribution to Q3 GDP, showing regular investment is lacking in our economy. Structures, or commercial real estate, contributed -0.13 percentage points and other investments, such as computers, down –0.13 percentage points, and software, up 0.12 percentage points, canceled each other out in terms of giving any real economic growth.
Motor Vehicles as a whole gave a –0.47 percentage point GDP contribution. Computer final sales, was 0.17 by percentage points. These are different from personal consumption, or C sub-components, such as auto & parts. These are overall separate indices to show how much they added to GDP overall. Motor vehicles, computers are bought as investment, as fleets, in bulk, by the government, as well as part of consumer spending, government spending and so on. Structures as a whole, added 0.14 percentage points to GDP, in spite of fixed investment structure subtracting from economic growth.
The price index for gross domestic purchases, was 1.5% for Q3, whereas Q2 was 0.7%. In other words, there was way more inflation than last quarter, corresponding to the rise in oil prices for Q3. Core price index, or prices excluding food and energy products, was 1.3%. Q1's core price index was 1.4%.
Nominal GDP: In current dollars, not adjusted for prices, Q3 GDP, or the U.S. output, is $15.776 trillion, a 5.0% increase from Q2. The 2nd quarter saw a 2.8% increase. Applying the price indexes, or chained, real 2005 dollars, Q3 2012 GDP was $13.616 trillion. Both numbers are annualized.
Gross domestic purchases are what U.S. consumers bought no matter whether it was made in Ohio or China. It's defined as GDP plus imports and minus exports or using our above equation: where P = Real gross domestic purchases. Real gross domestic purchases was 2.1%, whereas last quarter was 1.0%. Exports are subtracted off because they are outta here, you can't buy 'em, but imports, as well a know all too well, are available for purchase at your local Walmart. When gross domestic purchases exceed GDP, that's actually bad news, it means America is buyin' imports instead of goods made domestically.
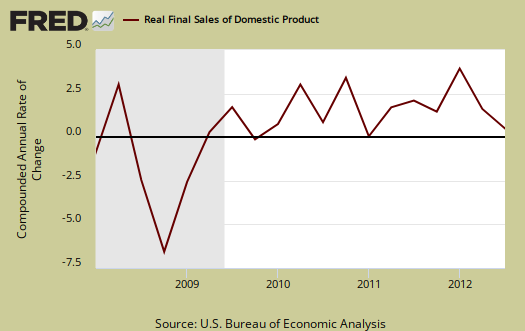
Below are real final sales of domestic product, or GDP - inventories change. This gives a better feel for real demand in the economy. This is because while private inventories represent economic activity, the stuff is sitting on the shelf, it's not demanded or sold. Real final sales increased 2.1% for Q3, whereas real final sales for Q2 were 1.7%.
Below are the percentage changes of Q3 2012 GDP components, from Q2. There is a difference between percentage change and percentage point change. Point change adds up to the total GDP percentage change and is reported above. The below is the individual quarterly percentage change, against themselves, of each component which makes up overall GDP. Additionally these changes are seasonally adjusted and reported by the BEA in annualized format.
|
Q3 2012 Component Percentage Change (annualized) |
|||
|---|---|---|---|
| Component | Percentage Change from Q2 | ||
| GDP | +2.0% | ||
| C | +2.0% | ||
| I | +0.5% | ||
| G | +3.7% | ||
| X | –1.6% | ||
| M | –0.2% | ||
The BEA's comparisons in percentage change breakdown of 2nd quarter GDP components are below. Changes to private inventories is a component of I.
C: Real personal consumption expenditures increased 2.0 percent in the third quarter, compared with an increase of 1.5 percent in the second. Durable goods increased 8.5 percent, in contrast to a decrease of 0.2 percent. Nondurable goods increased 2.4 percent, compared with an increase of 0.6 percent. Services increased 0.8 percent, compared with an increase of 2.1 percent.
I: Real nonresidential fixed investment decreased 1.3 percent in the third quarter, in contrast to an increase of 3.6 percent in the second. Nonresidential structures decreased 4.4 percent, in contrast to an increase of 0.6 percent. Equipment and software decreased less than 0.1 percent, in contrast to an increase of 4.8 percent. Real residential fixed investment increased 14.4 percent, compared with an increase of 8.5 percent.
X & M: Real exports of goods and services decreased 1.6 percent in the third quarter, in contrast to an increase of 5.3 percent in the second. Real imports of goods and services decreased 0.2 percent, in contrast to an increase of 2.8 percent.
G: Real federal government consumption expenditures and gross investment increased 9.6 percent in the third quarter, in contrast to a decrease of 0.2 percent in the second. National defense increased 13.0 percent, in contrast to a decrease of 0.2 percent. Nondefense increased 3.0 percent, in contrast to a decrease of 0.4 percent. Real state and local government consumption expenditures and gross investment decreased 0.1 percent, compared with a decrease of 1.0 percent.
Here is our overview for Q2 GDP and other reports on gross domestic product can be found here.
G=I=C all one web
The formula gets a lot of ink but is of dubious value,G is so tightly intertwined with I and C that distinctions are meaningless. It is one large entity losing some trillions of dollars a year. Five hundred billion in cash and a few trillion in non-renewable resources. To assume less G will be less GDP needs actual data. It is easy to imagine the reverse. To assume more GDP is a good idea is also an empirical question.
that is simply not true
and if one bothered to read the BEA handbook on NIPA one would see that G is very different from C and I, which are private sector. G is spending and investment by the government but excludes transfer payments, such as Medicare and Medicare, social security.