
The Federal Reserve Industrial Production & Capacity Utilization report shows industrial production had a 0.7% blowout for July. This is the largest increase since November 2014. Manufacturing production by itself increased 0.5% and was the biggest advance since July 2015. Even mining increased 0.7% for the month. Utilities' 2.1% increase was due to the very warm weather. The G.17 industrial production statistical release is also known as output for factories and mines.

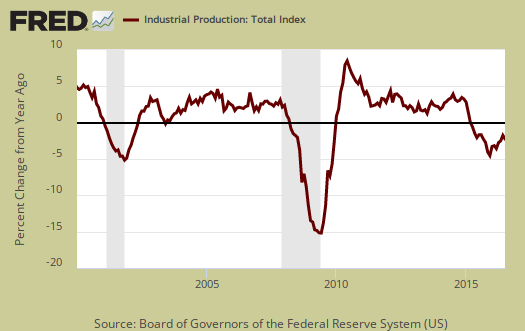
Total industrial production is still below -0.5% from what it was a year ago. July industrial production was 4.9 percentage points above the 2012 average. Industrial production is still way below the very long term 1972-2015 average by -4.1 percentage points. Below is graph of overall industrial production's percent change from a year ago. Notice how closely industrial production follows the grey recession bars.
Here are the major industry groups industrial production percentage changes from a year ago. The percentages for mining have dropped -1.5 percentage points on average for the last eight months.
- Manufacturing: +0.2%
- Mining: -10.2%
- Utilities: +3.5%
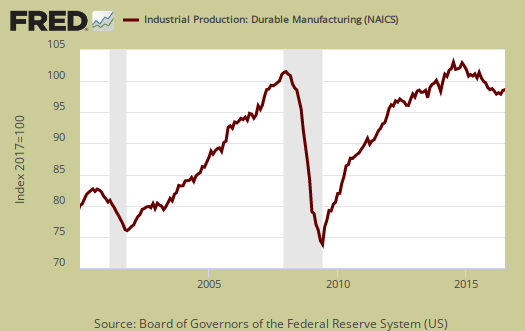
For the month manufacturing overall increased by 0.5%. June saw a 0.3% increase while May showed a -0.2% drop. Manufacturing output is 3.6 percentage points above its 2012 Levels and is shown in the below graph.

Within manufacturing, durable goods had a 0.6% monthly increase. Machinery gained 2.0% and Motor vehicles & parts increased 1.9% for the month. Primary metals, on the other hand, declined by -1.1%.
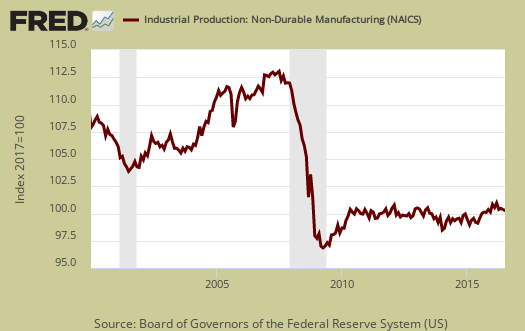
Nondurable goods manufacturing increased 0.5% for the month. Petroleum and coal products categories plus the Plastics and rubber category had a 1.0% monthly increase. Food, beverages and tobacco had a 0.2% increase, plastics 0.4% while others decreased. Apparel and leather declined -0.4% for the month and is down -10.4% for the year. Printing and support decreased by -1.3% and is down -3.2% for the year.
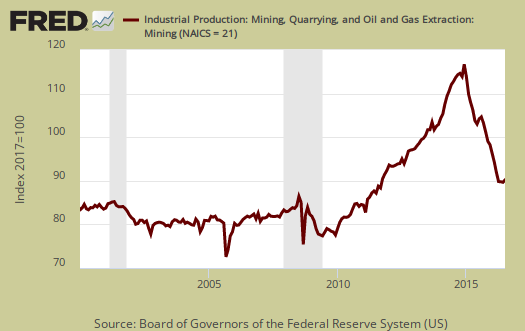
Mining increased by 0.7% and is now down -10.2% for the year. Mining includes gas and electricity production and oil and gas extraction declined by -1.7% for the month while coal mining soared by 15.3%. Oil well drilling and servicing increased by 5.5%. The Fed have a special aggregate index for oil and gas well drilling. Oil and gas well drilling increased 4.9% for the month and for the year is down -46.9%. Coal by itself declined over -40% in the past year.
Below is oil and gas well drilling to show the incredible bust in production.

Utilities increased by 2.1%. Utilities are often volatile due to changes in weather, as shown below.

There are two reporting methodologies in the industrial production statistical release, market groups and industry groups. Market groups is output bundled together by market categories, such as business equipment or consumer goods and shown below:
The indexes for most major market groups increased in July. The output of consumer goods rose 0.6 percent, with similarly sized gains for both consumer durables and consumer nondurables. The index for business equipment moved up 0.6 percent, led by gains in transit equipment and in industrial and other equipment. The output of defense and space equipment decreased 0.3 percent. The indexes for construction supplies and business supplies each increased 0.4 percent, their first gains since April 2016. In July, the production of materials increased 1.0 percent, as durable, nondurable, and energy materials all recorded gains. The improvement for durable materials reflected broad-based strength across its major categories. The gains among nondurable materials were somewhat less widespread, as both textile and paper materials registered decreases.
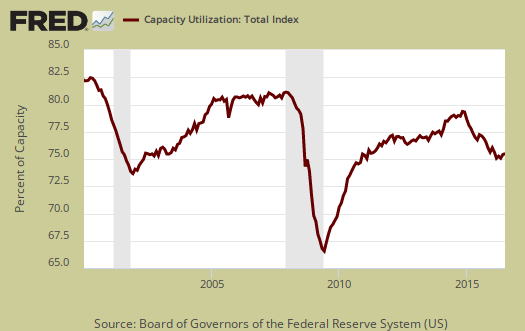
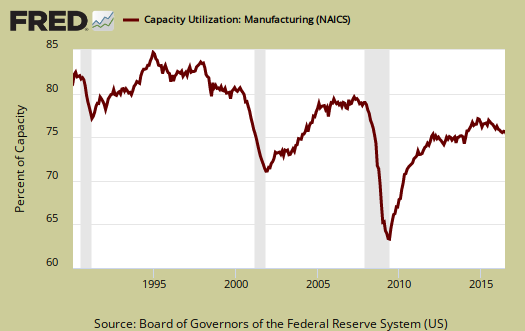
Capacity utilization, or how much raw capacity being used, for total industry is 75.9%, an increase of 0.5 percentage points from last month. . Capacity utilization has decreased by -0.8 percentage points from a year ago and is 4.1 percentage points below the long run average. These figures have been slightly improving over the year. Manufacturing capacity utilization increased 0.4 percentage points for the month, is 75.4% and is 3.1 percentage points below it's long run average. Mining capacity utilization jumped by 0.8 percentage points to 74.9%. Mining capacity has still declined by a full -7.0 percentage points from just a year ago. Utilities use of it's capacity is 81.0% and this a monthly increase of 0.6 percentage points.
Capacity utilization is how much can we make vs. how much are we currently using, of what capacity is available now, or output rate. Capacity utilization is also called the operating rate. Capacity utilization is industrial production divided by raw capacity.
Capacity growth is raw capacity and not to be confused what what is being utilized. Instead, this is the actual growth or potential to produce. Capacity is the overall level of plants, production facilities, and ability to make stuff, that we currently have in the United States. Capacity growth overall has increased 0.5 percentage points from a year ago. Below is the capacity growth increase from a year ago of the subcategories which make up industrial production.
- Manufacturing: +0.7%
- Mining: -1.8%
- Utilities: +0.7%
Below is the Manufacturing capacity utilization graph and notice how the 2001-2003 time frame starts to slide as manufacturing goes offshore in a series of bad trade treaties.
Overall while this month's report was actually a pop up in coal and a much better manufacturing number. Utilities swing quite a bit, but it wasn't all of July's report. Eventually mining's free fall has to bottom out, even if demand does not return. Here are our previous overviews, only graphs revised. The Federal Reserve releases detailed tables for more data, metrics not mentioned in this overview.
Recent comments