
The Federal Reserve Industrial Production & Capacity Utilization report shows industrial production decreased -0.3% as gas and oil well drilling continues to collapse. Overall mining contracted a very large -0.8%. Manufacturing was unchanged. March also showed a -0.3% industrial production change. This if the fifth month in a row for a loss. The G.17 industrial production statistical release is also known as output for factories and mines.
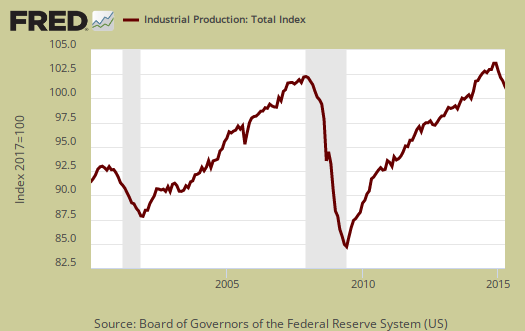
Total industrial production has now increased 1.9% from a year ago. Currently industrial production is 5.2 percentage points above the 2007 average. Below is graph of overall industrial production's percent change from a year ago.

Here are the major industry groups industrial production percentage changes from a year ago.
- Manufacturing: +2.3%
- Mining: +1.3%
- Utilities: +0.1%
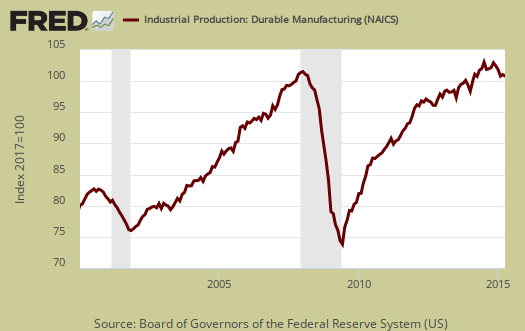
For the month there was no change in manufacturing and the previous month saw a 0.3% increase. Manufacturing output is 1.5 percentage points above it's 2007 Levels and is shown in the below graph.

Within manufacturing, durable goods increased 0.1% for the month and 2.6% for the year. Motor vehicles & parts increased 1.3%. Machinery dropped -0.9%.
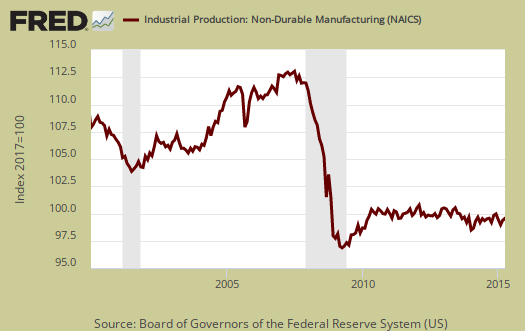
Nondurable goods manufacturing showed a -0.1% gain for the month as food, beverages, tobacco showed a -0.6% drop. Nondurable manufacturing has increased 2.5% for the year.
Mining showed a -0.8% monthly decrease, and is now up 1.3% for the year, but at this rate, don't count on a year to year expansion in mining. Mining includes gas and electricity production and the Fed have a special aggregate index for oil and gas well drilling. Oil and gas well drilling dropped a whopping -14.5% and for the year is down -46.5%. This is an astounding collapse in well drilling.

Below is oil and gas well drilling and one can see the boom and bust cycle.

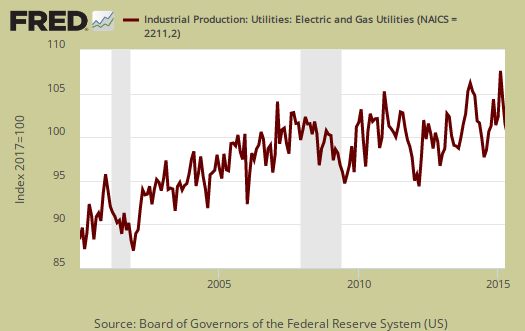
Utilities declined -1.3% for the month and have increased only 0.1% for the year. Utilities are volatile due to weather and why the below graph shows the wild swings. One can track the polar vortexes and heat waves in the below graph.
There are two reporting methodologies in the industrial production statistical release, market groups and industry groups. Market groups is output bundled together by market categories, such as business equipment or consumer goods and shown below:
Construction supplies and business supplies were the only major market groups to post production gains for April, with increases of 0.1 percent and 0.3 percent, respectively. The index for consumer goods declined 0.3 percent; decreases both for consumer energy products and for non-energy nondurables more than offset an increase for consumer durables. The production of business equipment moved down 0.4 percent, as a small gain in information processing equipment was outweighed by cutbacks in transit equipment and in industrial and other equipment. The output of defense and space equipment declined 0.3 percent. The index for materials decreased 0.2 percent as a result of a reduction of 0.5 percent in energy materials.
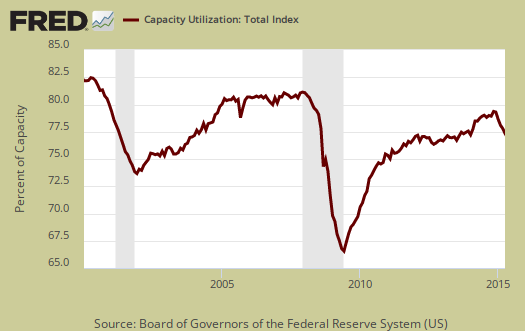
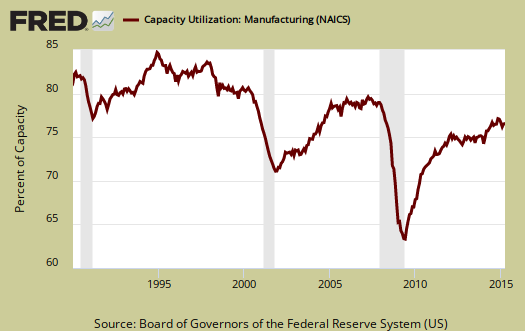
Capacity utilization, or of raw capacity, how much is being used, for total industry is 78.2%, a decline of -0.4 percentage points from last month. . Capacity utilization has decreased -0.8 percentage points from a year ago and is -1.9 percentage points below the long run average. Utilization of capacity is simply going in the wrong direction. Manufacturing capacity utilization is 77.2% and is 1.4 percentage points below it's long run average. Manufacturing capacity utilization declined -0.1% for the month/ . Within manufacturing durable and non durable goods capacity utilization declined and both are down about .75 percentage points below the long term average Mining capacity utilization is 84.0% and is down -3.3 percentage points from a year ago. and -0.9 percentage point for the month. Utilities use of it's capacity is 78.8% and has down -1.0 percentage points for the month.
Capacity utilization is how much can we make vs. how much are we currently using, of what capacity is available now, or output rate. Capacity utilization is also called the operating rate. Capacity utilization is industrial production divided by raw capacity.
Capacity growth is raw capacity and not to be confused what what is being utilized. Instead, this is the actual growth or potential to produce. Capacity is the overall level of plants, production facilities, and ability to make stuff, that we currently have in the United States. Capacity growth overall has increased 2.9 percentage points from a year ago and the same as last month. Below is the capacity growth increase from a year ago of the subcategories which make up industrial production.
- Manufacturing: +2.0%
- Mining: +8.0%
- Utilities: +0.8%
The above increase in mining will surely deflate and that is not good for a host of local economies like in North Dakota. Below is the Manufacturing capacity utilization graph, normalized to 2007 raw capacity levels, going back to the 1990's. Here is where offshore outsourcing really shows up. Pay particular attention to the 2001-2003 as manufacturing had a mass exodus to China after passage of the bad trade deal in 2000.
This report just gives another data point that Q2 data so far is not good and those expecting a rebound from the terrible first quarter are looking to be sorely disappointed. Some will try to blame gas prices, but manufacturing growth continues to be stunted and that shows dark clouds on the overall economy, not just oil & gas.
Here are our previous overviews, only graphs revised. The Federal Reserve releases detailed tables for more data, metrics not mentioned in this overview.
Recent comments