
The July 2012 BLS unemployment report shows total nonfarm payroll jobs gained were 163,000. Don't get too excited, while above expectations this is still a mediocre report. June's payrolls were revised down, from 80,000 to 64,000. May's payrolls were revised up, from 77,000 to 87,000. The below graph shows the monthly change in nonfarm payrolls employment.
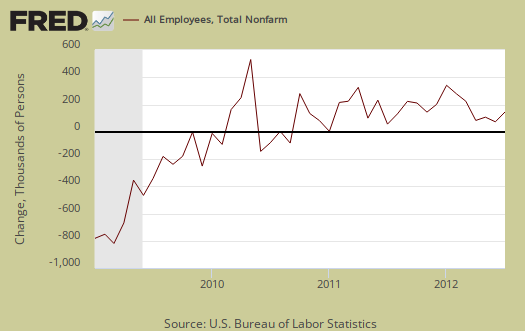
July shows 172,000 private sector jobs gained while government payrolls shrank another -9,000. In addition, at least 14,100 of those private jobs were temporary.
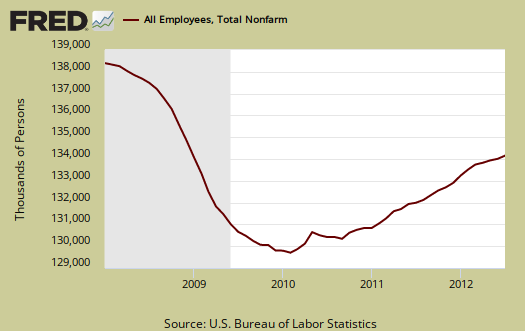
The start of the great recession was declared by the NBER to be December 2007. The United States is now down -4.737 million jobs from December 2007, 4 years and 7 months ago.
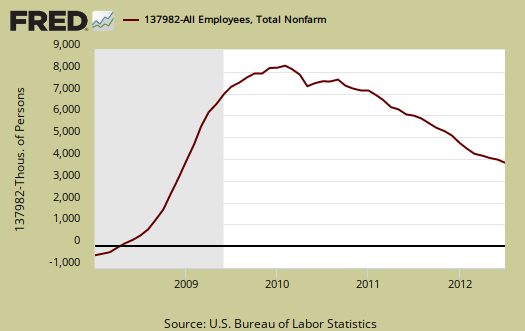
The below graph is a running tally of how many official jobs are permanently lost, from the establishment survey, since the official start of this past recession. Increased population growth, implies the United States needs to create at least 10.4 million jobs or self-employment, using the population survey statistics. This estimate assume a 62.7% civilian non-institutional population to employment ratio, as it was in December 2007. This implies an additional 5.63 million jobs were needed over a 55 month time period beyond the ones already lost. This is just taking into account increased population against the payroll jobs gap, the actual number of jobs needed is much higher, in part because payrolls or CES, and population, i.e. CPS, are two separate employment surveys from the BLS.
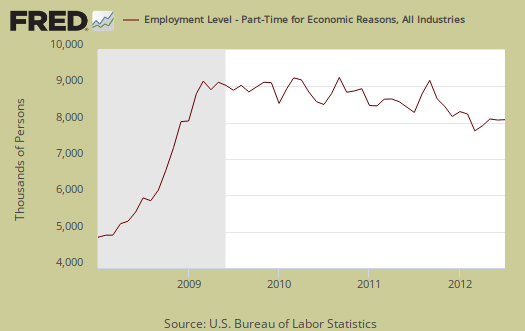
Another problem with the employment market is the gross number of part-time jobs generally. There is a huge number of people who need full-time jobs with benefits who can't get decent jobs. Those forced in part time jobs increased by 36 thousand to 8.25 million. That's a hell of a lot of people stuck in part-time jobs who need full-time work.
The official unemployment rate ticked up a 10th of a percentage point to 8.3% with 12,794,000 officially unemployed.
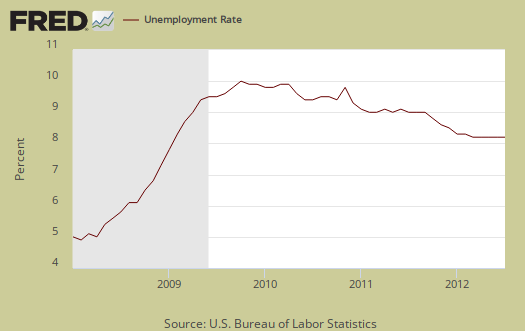
U-6 is a broader measure of unemployment and includes the official unemployed, people stuck in part-time jobs and a subgroup not counted in the labor force but are available for work and looked in the last 12 months. Believe this or not, U-6 still leaves out some people wanting a job who are not considered part of the labor force. U-6 ticked up 0.1 percentage points to 15.0%.

The labor participation rate, dropped a 10th of a percentage point to 63.7%. If we go back to December 2007, the labor participation rate was 66%. The highest civilian labor participation rate was in January 2000, at 67.3%. What a low labor participation rate means is there are over 5.6 million people not be accounted for in the official unemployment rate, in other words counted as employed or unemployed, many who probably need a job and can't find one, in comparison to 2007. That's in addition to the official 12.794 million unemployed.

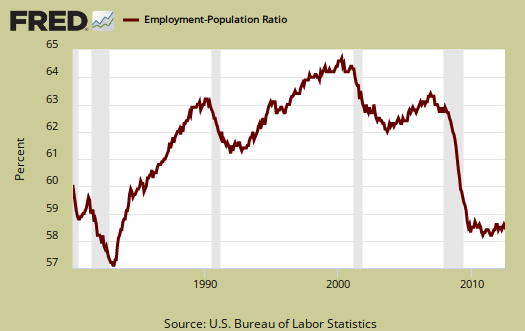
The employment to population ratio dropped -0.2 percentage points to 58.4%. In January 2008 the employment to population ratio was 62.9%. You have to go back to the severe recession of 1983, October to find such low ratios, but in the 1983 case, the low ratios were short lived, unlike the past few years.
The low employment to population ratios clearly show people dropping out of the labor count. We can see this by the cliff dive employment to population ratio during 2008-2010. There is no way magically, suddenly, a huge increase of population volunteered to drop out of the labor force, turned 65 at once, or magically all went to school. These are mostly people plain out of a job. The cliff dive in employment to population ratio represents about 11 million people, which is around the same amount of jobs really needed to keep up with population growth calculated above.
The official unemployment rate is a ratio, a percentage during a limited time period to calculate the number of people actively looking for a job and counted. Many people are not counted in the official unemployment statistics. Truth is America has more potential workers and less jobs in this so called recovery than any other period past the Great Depression.
How did the U.S. add 163,000 jobs yet the unemployment rate actually increased? The BLS employment report is actually two separate surveys. The jobs number comes from the CES, or establishment survey where the unemployment ratios comes from a different survey, the CPS, otherwise known as the Household survey. The unemployment rate is a ratio of those officially unemployed to those officially counted as part of the labor force.
Less people were considered part of the labor force in July. Those not in the labor force increased by 348,000 while the overall non-institutional population rose by 199,000. The civilian labor force decreased by -150,000, whereas those officially unemployed increased by 45,000. Yet those officially employed also decreased by -195,000. In other words, the payrolls survey says something different from the population survey which shows jobs actually declined. The population survey also shows a huge number of people dropped out of the labor force. In other words, by the CPS, we actually lost jobs for the month and more people were added to the unemployment rolls.
Going off of the monthly changes of the CPS survey is statistically risky. The monthly changes are highly noisy and the CES, or payrolls survey is deemed more accurate and stable. We'll have more analysis on why that is, plus take a look at half a year of data instead, in upcoming articles.
For more information on how the BLS tabulates non-farm payroll jobs, see this article, Under the Hood of the Employment report.
Here is last month's overview, only some graphs revised.
technical glitch, more analysis to come on employment
Folks, we had technical difficulties this morning. That said, we'll have much more to come on labor statistics.
Est. of additional analysis, this evening
Sorry folks, I'm looking at a host of data and I don't want to write something inaccurate. Gonna take awhile.
Information re: prior median wages vs. wages in new jobs
Is there a specific source available for the median wages people earned in these 2012 jobs vs. the median wages in those previously held pre-Great Recession? This would shut down the whole "Hey, 160,000 new jobs! Awesome! Now only 25 million more to go!" talk if the part-time, no benefits jobs were specifically shown to keep people in poverty vs. the old jobs we lost that could at least feed and house one or two people.
Just looking at hrs/wages + survey definitions
There is something seriously fuked up when the CPS drops by that amount yet the CES increases. I was just looking over wages, hrs, earnings for hrs. increase is "akin" to about 300k jobs. Be writing up what I can figure out shortly. Surveys have different methodologies, time windows.
workweek, hrs unchanged from June
Everything was unchanged, so increased hours isn't going to help us here in terms of employment. wages, TBD, I might do something separate and fuse the BEA personal income revisions with the BLS wage data together, since the 3 yrs of revisions showed we're all poorer than originally thought.
There are claims that 400,00 due to B/D + seasonal adj.
Sites are claiming that seasonal adjustments and birth and death numbers in latest stats are massive, upwards of 400,000. I haven't looked to verify, but even if a fraction of that number, statistical "games" to boost numbers would seem to be out of control, with the only expectation they will get worse closer to election. According to the MSM message, unemployment rate going down = good sign because more jobs. Unemployment rate going up today from 8.2 to 8.3% (8.3%, let's at least double that for anything close to reality) = good news because more people entering work force. Apparently, any unemployment rate they come up with is good news. 30% would be great because more people would feel good about looking for work once again!
Well, at least the stock market HFT machines could read positive news in the headlines. That caused Farcebook to jump 10% and have everyone happy to forget it's close to 50% off its IPO highs. So, the stock market, barometer of nothing but easy Fed money and manipulation, is pleased, and that's all that counts to TV control rooms.
that's why the delay
I also had to deal with something else, but frankly ZH has "gotten it wrong" so many times but I'm looking into the SA from the data. I do think it's highly probable we're going to see a downward revision to these figures for next month.
The "birth/death" model they freak out on every month, so I'll cover that as well.
people left the workforce, not entered
I covered this above but the reason the unemployment rate increased is these are two different surveys, the CPS one gives the unemployment rate and it shows a drop in employment of 195k.
Seasonal adjustments are dictated by a host of methods, including a software program. I've been looking at these adjustments but I still am not positive on the validity.
Bottom line we have "job growth" in the margin of error so often of these surveys, we're counting crumbs. Also, the month to month numbers, we cover them, but really it's better to go quarterly, statistically speaking.
Labor Particioation Avoids a few Games
Maybe we should just focus on the Labor Participation Rate. On that basis, we are at- 63.7 as a percentile, The Participation number also could shows how immigration and population growth effect the employment. Germany has a Participation Rate of 78% , Switzerland has a 83%.
German and Swiss numbers tell bring up a number of issues about their societies vs the American Unexceptionalism. Best of all, the Percent Employed/Population number is much harder to fudge.
Burton Leed