
The U.S. August 2013 monthly trade deficit barely budged from last month, a 0.4% increase and now stands at -$38,803 billion. America still runs a surplus in services, now at $19.417 billion, but the goods deficit is still massive and this month was -$58.220 billion.

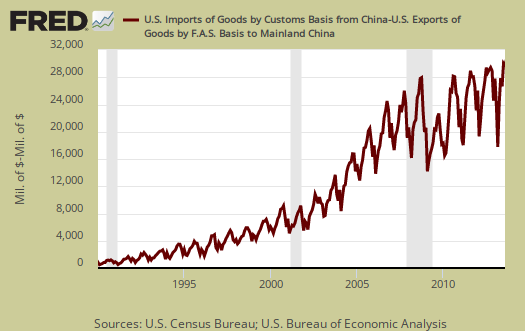
The China trade deficit is on track to hit another annual record and this month maintained it's highs with a not seasonally adjusted -$29.891 billion China trade deficit The China trade deficit alone was 49% of the not seasonally total goods deficit, on a Census accounting basis. The U.S. hit a new record annual 2012 $315 billion trade deficit. The 2013 the trade deficit with China to date is -$207.679 billion with four more months to go. The below graph shows how highly cyclical the monthly trade deficit with China is. Country trade statistics are not seasonally adjusted, yet this time last year the 2012 cumulative China trade deficit was -$203.067 billion.
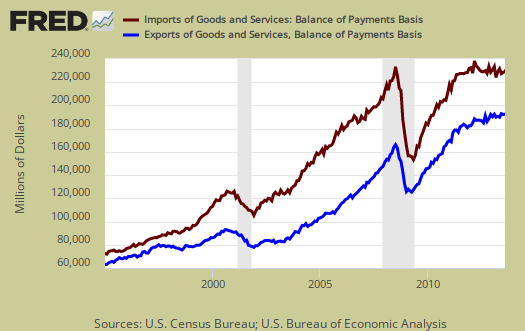
Graphed below are imports and exports graphed and by volume, note the global trade collapse in 2009 due to the recession. Imports are in maroon and exports are shown in blue, both scaled to the left. We can also see what bad trade treaties has wrought by the below graph.
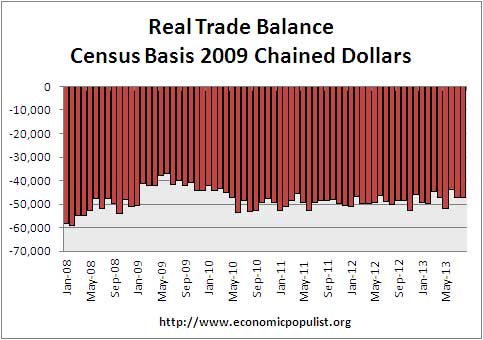
In real dollars, or adjusted for inflation, the goods trade deficit is flat with last month as shown in the below graph. September historically has not shown much change from August, so if we assume a real valued goods trade deficit for September of -$48 billion, the change from Q2 to Q3 would be just -1.0% or very little change from Q2 in the growth of the goods trade deficit. In Q2, the change in imports and exports basically cancelled each other out resulting in the trade deficit not being a drag on the economy. Unless there is a September surprise in the monthly trade figures or import/export prices, it is a safe bet than the trade deficit won't be the Q3 GDP bummer as it commonly is. The government shutdown on the other hand, is expected to negatively impact GDP by 0.3 percentage points of growth lost.
Oil or petroleum related end use was 33% of the goods trade deficit by SITC classification. End use means the final use of the product and includes oil byproducts. For example, plastics are made up of petroleum, yet by their end use category, would be marked often as consumer goods. The Wall Street Journal also noticed the decline, yet we don't believe their calculation of petroleum being 47.9% of the trade deficit is quite right. Petroleum is reported via the STIC accounting method and trade services are added to the balance of payment method to obtain the total monthly seasonally adjusted trade deficit. Yet the point is valid, petroleum as part of the overall trade deficit is still quite high.
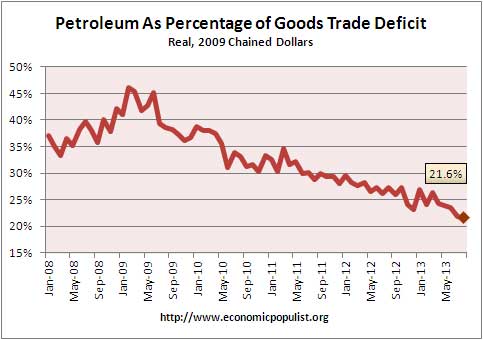
If we take the real valued end use of petroleum versus non-petroleum of the goods trade deficit, it is quite true that petroleum as a percentage of the trade deficit is decreasing. Real means the balance figures are adjusted prices using chained 2009 dollars so inflation is not in the mix. Below is a graph of petroleum end use deficit as a percentage of the goods trade balance and this breakdown is by the Census accounting method and in 2009 chained dollars. What we see is domestic production in energy has truly helped with the trade deficit, yet China imports more than take up the slack in continuing to send the U.S. economy abroad.
Here are other trade deficit overviews, data unrevised.
Recent comments