
Multifactor productivity for the private business sector excluding farms had the largest increase in the history of record keeping for 2010. So states the BLS in their report.
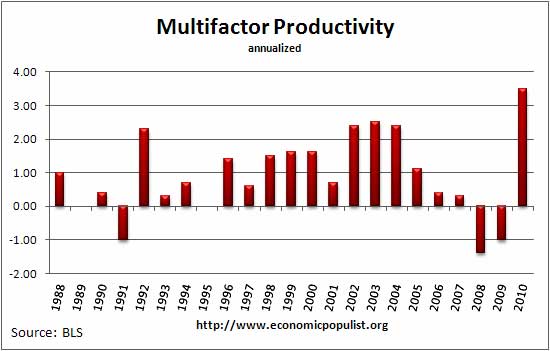
Private nonfarm business sector multifactor productivity increased at a 3.5% annual rate in 2010, the U.S. Bureau of Labor Statistics reported today. This was the largest increase recorded in the series, which began in 1987. The multifactor productivity gain in 2010 reflected a 4.0% increase in output and 0.5% increase in the combined inputs of capital and labor. Capital services grew by 0.4%, and labor input – which is the combined effect of hours worked and labor composition – grew 0.5%. The combination of fast-rising output and a modest increase in capital services caused output per unit of capital services to rise 3.6%, the largest gain since the series began in 1987.
Multifactor productivity is the ratio of output to capital and labor inputs of the private sector economy and is reported in real, or adjusted for inflation, dollars. A layman's interpretation of this blow out number is private businesses managed to jump start output while operating on fumes. In other words, in 2010 there were few new hires and beyond changes in inventories, little investment, yet the private sector managed to produce, or output, a hell of a lot services and stuff in spite of the 2009 people and capital slash-n-burn, search and destroy layoffs and cutbacks these same businesses did.
That said, there are simply some real funky sub-calculations in this statistic and other researchers are questioning what the BLS is really measuring these days. For example, gender, age and educational levels go into the labor calculation. Now what gender has to do with increased productivity is a very good question...unanswered. Why gender matters, versus finally tabulating out all of the foreign guest workers and categorizing them as not domestic and thus not part of the domestic labor tabulation is another question unanswered. That said, multifactor productivity is quite a complex measurement and it is what it is. These 2010 results are somewhat explained when one looks at GDP growth components (output) in 2010.
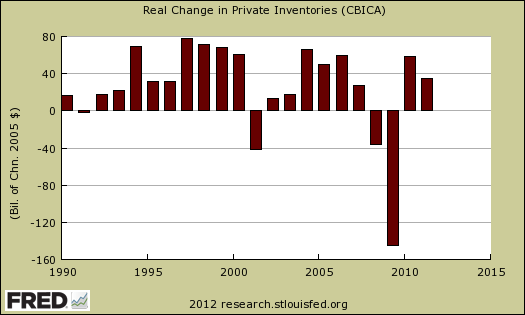
Take for example the wild ride changes in private inventories has taken, graphed above. Additionally in the multifactor productivity graph one can see after a recession multifactor productivity does balloon up simply because businesses are ratcheting up for stronger demand of their products and services.
The latest BLS productivity trends for manufacturing are from 2009. ITIF's Robert D. Atkinson has a bone to pick over these soaring manufacturing productivity numbers. In Worse than the Great Depression, Atkinson writes:
In the 2000s, U.S. manufacturing suffered its worst performance in American history. Not only did America lose 5.7 million manufacturing jobs, but the decline as a share of total jobs (33 percent) exceeded the rate of loss in the Great Depression.
No kidding, while economists claim soaring productivity means higher income for workers clearly that is not the case and hasn't been for some time. In a new report Atkinson finds different productivity results that do seem to jive with what everyday Americans see on the street:
U.S. manufacturing output actually fell 11 percent over the last decade while GDP increased 17 percent, something that has not happened before, at least since WWII.
Moreover, manufacturing productivity grew just 32 percent, not the reported healthy 72 percent. If productivity growth was actually 72 percent, one would expect that U.S. manufacturers would have added plenty of machines and factories over the last decade to be more productive, as they have done every decade since WWII. In fact, total U.S. manufacturing capital stock increased just 2 percent, compared to historic rates of growth of between 20 and 50 percent per decade.
We see what Atkinson is pointing to every month in the industrial production report. Raw capacity actually declined during the great recession. Anyone with a pair of eyeballs sees empty factories, plants with weeds, not stunning manufacturing facility growth.
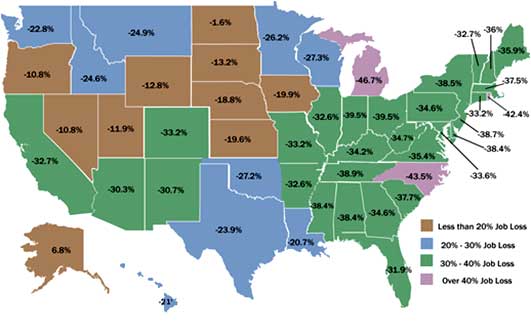
One of the most frightening images from the ITIF publication, Worse Than the Great Depression: What the Experts Are Missing About American Manufacturing Decline is the job losses per state in manufacturing, reprinted below. Michigan is #1 in manufacturing job losses with almost half, 46.7% jobs lost from 2000 to 2010.
Upjohn Institute's Susan Houseman has been researching into productivity for years, hunting for those elements which deny globalization and outsourcing are a real drain for the average American's economic well being. She's found a few things with price indices.
We show that the substitution of imported for domestically produced goods and services—often known as offshoring—can lead to overestimates of U.S. productivity growth and value added. We explore how the measurement of productivity and value added in manufacturing has been affected by the dramatic rise in imports of manufactured goods, which more than doubled from 1997 to 2007. We argue that, analogous to the widely discussed problem of outlet substitution bias in the literature on the Consumer Price Index, the price declines associated with the shift to low-cost foreign suppliers are generally not captured in existing price indexes. Just as the CPI fails to capture fully the lower prices for consumers due to the entry and expansion of big-box retailers like Wal-Mart, import price indexes and the intermediate input price indexes based on them do not capture the price drops associated with a shift to new low-cost suppliers in China and other developing countries. As a result, the real growth of imported inputs has been understated. And if input growth is understated, it follows that the growth in multifactor productivity and real value added in the manufacturing sector have been overstated. We estimate that average annual multifactor productivity growth in manufacturing was overstated by 0.1 to 0.2 percentage point and real value added growth by 0.2 to 0.5 percentage point from 1997 to 2007. Moreover, this bias may have accounted for a fifth to a half of the growth in real value added in manufacturing output excluding the computer and electronics industry.
In the paper Offshoring Bias in U.S. Manufacturing: Implications for Productivity and Value Added, the authors identify a big problem. Multifactor productivity equations are complex and use intermediate outputs. Contained within these intermediate output tabulations are actually materials coming as imports, not domestically sourced.
We find that non-energy materials inputs from domestic sources actually fell while foreign non-energy materials inputs to manufacturing expanded nearly fifty percent—to 25 percent of all materials inputs—from 1997 to 2007. Moreover, developing- and intermediate-income countries accounted for almost all of this growth in import market share, with developing countries, mainly China, accounting for over half of the pick-up.
Further still, an excellent Washington Post article, also questioned productivity metrics and what they are actually measuring. They state this starling statistic:
The number of consumer electronics shipped from U.S. factories dipped about 70 percent between 2000 and 2010, according to the Census Bureau’s Current Industrial Report.
Then Atkinson also discovered another funky tabulation surrounding computers:
Measurement of the computers and electronics industry (NAICS 334) is a particular problem. Because of Moore's law computers get more powerful every year. But when a company makes a computer that is twice as fast than the one it did two years, ago, the government counts it as if they produced two computers. This is why according the government statistics, from 2000 to 2010, the computer and electronics sector increased its real U.S. output over 5.17 times. Compare this with electrical equipment, which saw a decline of 12 percent.
It is hard to believe that the U.S. computer and electronics sector is producing 5.17 times more in the United States than it was a decade ago, given the fact that its employment declined by 43 percent and according the U.S. Census Bureau's the number of units of consumer electronic products shipped from U.S. factories actually fell by 70 percent.
Needless to say understanding all methods, tabulations, sub-calculations, price deflators and NAICS code exceptions is an exercise for a PhD dissertation at minimum. The devil is in the details here. Beyond ruffling a few cube creature feathers, the details go unnoticed by the public and questions are dismissed as opinion. Not too good of a data objective situation when China is about to exceed the United States as the world's dominant economy. We went through some additional figures in productivity, gdp, jobs and outsourcing in 2009. It seems clear globalization, labor arbitrage, outsourcing are all negatively impacting the average American, yet quantifying the specifics is hard to come by. We don't have exact answers on this, although we suspect it's in the raw data collection and categorization methods. For example, we know the BLS does not separate out foreign guest workers from U.S. workers yet wage, labor arbitrage through foreign guest workers is notorious. How can one count foreign guest workers as domestic labor is beyond me, but there ya have it. One thing is clear, something is wrong with this picture when soaring productivity gains never make it to American workers pockets.
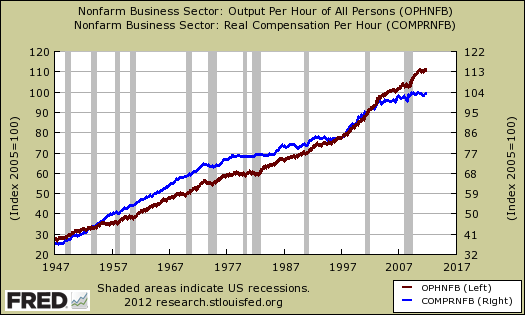
Above is a graph of labor productivity for private businesses (red line) versus real hourly compensation (blue line). The above graph shows compensation is not keeping up with productivity gains. In other words, workers are not sharing, benefiting from these soaring productivity numbers.
Comments
Any Zerohedge regular
Let ZH readers know about this piece. I usually end up refuting ZH's overviews on government data but I think on this one they might be amused.