
The U.S. August 2012 monthly trade deficit increased 4.1%, or $1.75 billion. July's trade deficit was revised upward by $462 million, which gives a 1.4% monthly increase for July's trade deficit instead of the reported no change. For August, exports decreased by -$1.91 billion, or -1.0%. Imports declined by -$845 million, or -0.4%.
The three month moving average gives a trade deficit of $42.861 billion, down from $43.987 billion in July.
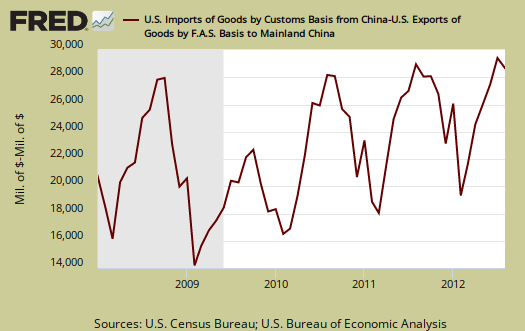
The U.S.-China goods trade deficit alone was, $28.688 billion, or 43.2% of the total goods trade deficit and this ratio includes oil, our largest commodity import. The year to date tally of the goods trade deficit with China is $203.121 billion, or 41.0% of the entire goods trade deficit to date. In August 2011, the China goods trade deficit up to that time was $189.378 billion and 39.3% of the total goods trade deficit. This is a year to date increase of 7.3% in the goods trade deficit with China in comparison to 2011. China's never ending import barrage is highly cyclical as one can see in the below graph of the not seasonally adjusted trade deficit with China and why we compare to this time last year in order to try to remove seasonality.
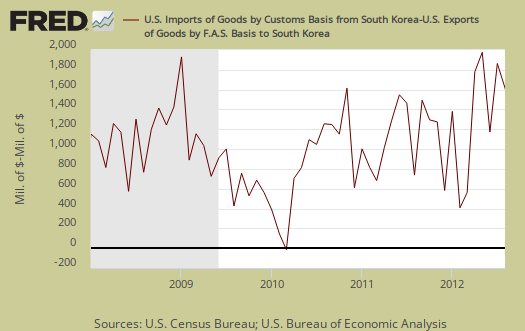
We should also mention the quick to increase South Korea-U.S. trade deficit. From January to August 2012 we have a $10.745 billion trade deficit with Korea. The same time period for 2011 shows a $8.616 billion Korean trade deficit, a 24.7% increase. March 15, 2012, the South Korean NAFTA style trade deal went into effect. Below is a graph of the Korean goods trade deficit, not seasonally adjusted and also cyclical, in particularly the cyclical high point seems to be December.
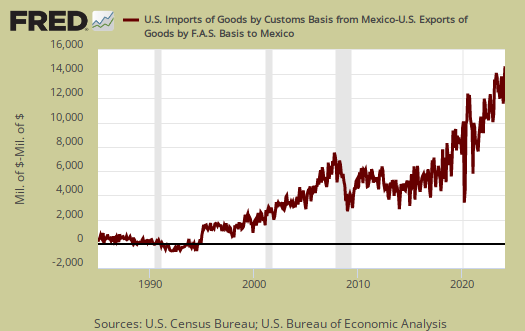
For comparison's sake, NAFTA went into effect January 1, 1994. Below is our goods trade deficit with Mexico, not seasonally adjusted. August's trade deficit with Mexico was $4.520 billion.
Oil or petroleum showed an end use trade deficit of $23.493 billion, for August, a increase of $2.458 billion, or 11.7%, from last month. Petroleum related end use was 40.0% of the goods trade deficit. When adjusted for prices, Petroleum related end use actually increased by 9.2%. Petroleum related imports from China as essentially non-existent.
End use means the final use of the product. For example, plastics are made up of petroleum, yet by their end use category, would be marked often as consumer goods.
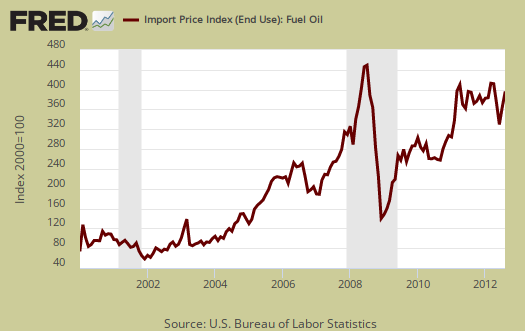
The United States basically has two major ongoing problems with the trade deficit, Chinese goods and Oil imports. Below is the not seasonally adjusted import price index for oil fuel. The average price for a barrel of oil in August was $94.36. For September, oil via the WTI, was $94.72/barrel.
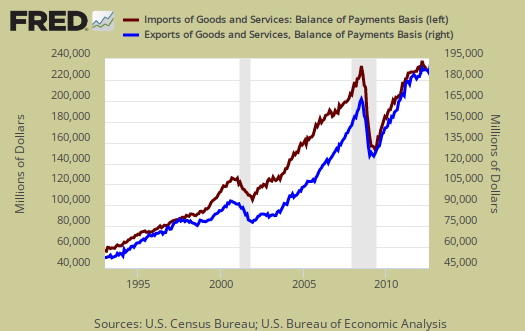
Below are imports vs. exports of goods and services. Notice how much larger imports (maroon) are than exports (purple), but also notice the growth, or rate of change between months of U.S. exports over time. To state the obvious, imports subtract from GDP and exports add. While pundits pontificate over exports, it's the deficit that really matters when it comes to economic growth or lack thereof.

Below is another view of imports (maroon, scale on the left) against exports (blue, scale on the right). Notice the time line. Before NAFTA, 1994 we were breaking even and not running a deficit in trade. The China PNTR came into effect at the end of year 2000 and since then we are getting more trade deals passed with the claim they create jobs. Clearly that is false, as our ballooning trade deficit shows. We are exporting jobs is more the case. Politicians who claim these bad trade deals increase jobs or even increase exports are praying you never read a chart or number in your life. Else, you would see the truth, our trade deficit simply keeps growing. Only a global recession, as happened in 2008, can cause the massive trade deficit to shrink.
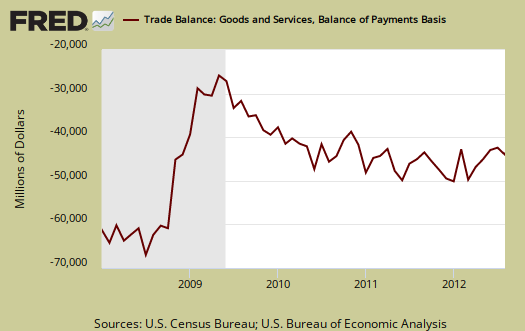
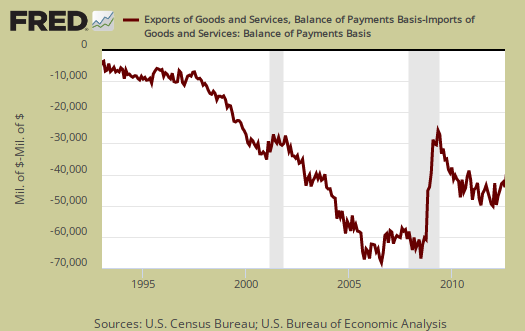
Below is another view of our trade deficit, as it grows with every bad treaty signed. The gray bars in the graph indicate recessions.
Below is the list of good export monthly changes, seasonally adjusted, by end use. The breakdown below is by the Census accounting basis, not the reported balance of payments amount and from exhibit 7. Goods exports, on a Census accounting basis, dropped -$2.170 billion in August. Soybean exports reversed themselves from last month with a -$1.391 billion drop in exports. Industrial materials plunged on a -$467 million on petroleum products, "other" as well as a -$246 million decline in fuel oil. Yes, we actually export fuel oil. Steel making products were not far behind, with a -$199 million drop in exports. Capital goods exports were salvaged by a $341 million increase in industrial engine exports. Consumer goods' export decline was caused by a -$494 million drop in drug exports (pharmaceutical preparations).
- Automotive vehicles, parts, and engines: -$0.087 billion
- Industrial supplies and materials: -$1.203 billion
- Other goods: +$0.225 billion
- Foods, feeds, and beverages: -$1.065 billion
- Capital goods: +$0.382 billion
- Consumer goods: -$0.422 billion
Below are the goods import monthly changes, seasonally adjusted. Overall imports decreased -$691 million from last month on a Census accounting basis. The story here is oil. Petroleum products, "other", increased by $831 million. Imports labeled "crude oil" increased $445 million. Fuel oil imports increased by $315 million. We were helped by a dramatic decline in Automotive related imports. Civilian aircraft imports also dropped by -$351 million in August. Apparel imports also dramatically dropped -$559 million.
- Industrial supplies and materials: +$1.529 billion
- Capital goods: -$0.507 billion
- Foods, feeds, and beverages: +$0.079 billion
- Automotive vehicles, parts, and engines: -$0.773 billion
- Consumer goods: -$1.192 billion
- Other goods: +$0.172 billion
Running a trade deficit in advanced technology is not a good sign for those jobs of tomorrow. The below report statistics are not seasonally adjusted.
Advanced technology products exports were $25.5 billion in August and imports were $32.3 billion, resulting in a deficit of $6.7 billion. August exports were $0.7 billion more than the $24.8 billion in July, while August imports were $0.7 billion less than the $33.0 billion in July.
Here is the breakdown with major trading partners, not seasonally adjusted. China is the worst trade deficit, as detailed above.
OPEC can be assumed to be oil and the OPEC nations are: Algeria, Angola, Ecuador, Iran, Iraq, Kuwait, Libya, Nigeria, Qatar, Saudi Arabia, United Arab Emirates, Venezuela. The trade deficit with Nigeria is not scams, it's oil, although considering how many financial scams originate from Nigeria, one might think so.
The August figures show surpluses, in billions of dollars, with Hong Kong $2.1 ($1.8 for July), Australia $1.8 ($2.1), Singapore $0.9 ($0.7), and Egypt $0.2 ($0.2).
Deficits were recorded, in billions of dollars, with China $28.7 ($29.4), European Union $11.7 ($12.0), OPEC $8.1 ($8.4), Japan $6.7 ($6.8), Germany $5.7 ($4.9), Mexico $4.5 ($5.0), Canada $2.4 ($2.1), Ireland $2.4 ($2.6), Venezuela $2.2 ($1.4), Korea $1.6 ($1.9), Taiwan $1.4 ($1.5), and Nigeria $1.1 ($0.8).
Here is the BEA website for additional U.S. trade data, such as it is. May we suggest the Census make publicly available much more data so one can compare Apples to Apples, end use, NAICS and seasonally adjusted series. In fact, please complain to your Congressional representatives, for the Census has not only redesigned their website to be impossible to use, demanding cookies and other 3rd party interfaces along with pages gone and ridiculous redirects, they also demand $300 dollars per year to access any detail in trade statistics. That's not cool, you paid for this data already through your tax dollars.
You might ask what are these Census Basis versus Balance of Payment mentioned all over the place? The above mentions various accounting methods so we're comparing Apples to Apples and not mixing the fruit. The trade report in particular is difficult due to the mixing of these two accounting methods and additionally some data is seasonally adjusted and others are not. One cannot compare values from different accounting methods and have that comparison be valid.
In a nutshell, the Balance of Payments accounting method is where they make a bunch of adjustments to not count imports and exports twice, the military moving stuff around or miss some additions such as freight charges. The Census basis is more plain raw data the U.S. customs people hand over which is just the stuff crosses the border. The 2005 chain weighted stuff means it was overall modified for a price increase/decrease adjustment in order to remove inflation and deflation time variance stuff.
Bottom line, you want just the raw data of what's coming into the country and going out, it's the Census basis and additionally the details are only reported in that accounting format. Additionally the per country data is not seasonally adjusted so watch out trying to add those numbers into the overall trade deficit. It's a statistical no-no to mix seasonal and non-seasonally adjusted numbers.
Here is last month's trade deficit overview, data unrevised.
Recent comments