
The National Association of Realtors released their pending home sales for January 2012 yesterday. Beware of revisions, we've seen irrational exuberance on pending home sales before. We had headline buzz blaring highest pending home sales since April 2010, perpetuated by NAR themselves, as well as declarations the housing bust is over.
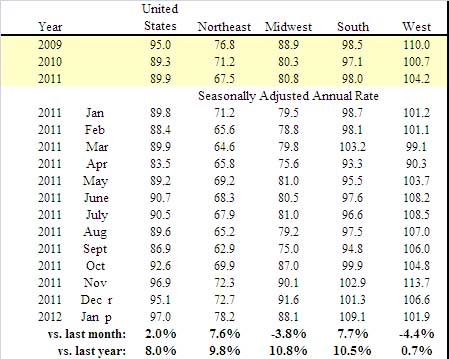
The Pending Home Sales Index, a forward-looking indicator based on contract signings, rose 2.0 percent to 97.0 in January from a downwardly revised 95.1 in December and is 8.0 percent higher than January 2011 when it was 89.8. The data reflects contracts but not closings.
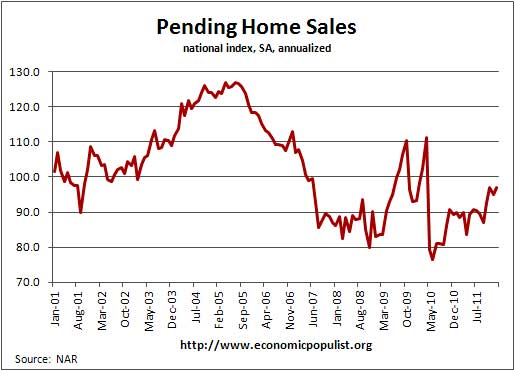
Yet when one looks at the graph, we see a few things. First, one immediately can tell how much lower January 2012 is than April 2010. We did not hit April 2010 levels. Second, the data is clearly statistically noisy, the slope is not a clean ascent or consistent monthly change. Then, we see the index higher when the housing market was in the depths of the deflated residential real estate bubble. Existing home sales do not add to GDP because they are a wealth transfer. The transaction fees do add to economic growth of course and selling existing homes creates jobs. Yet the actual existing home was already counted as economic growth when it was built. Finally, November was revised. Last November we had the same insane headline buzz reaction, yet after the headlines and happy land traders faded, the index was revised down from 100.1 to 96.9.
It helps to know what the pending home sales index is normalized to, 2001. Think about the U.S. population growth since 2001.
An index of 100 is equal to the average level of contract activity during 2001, which was the first year to be examined as well as the first of five consecutive record years for existing-home sales; it coincides with a level that is historically healthy.
We've seen this headline buzz before, pending home sales jump to a 2 year high. This financial press headline hype was for July 2009 PHSI. The actual 2009 data had everything to do with the temporary first time home buyer's tax credit versus a sustained residential real estate market recovery. It looks probable the worst is over for residential real estate but having a dramatic uptick in activity, just simply isn't appearing in other indicators.
The PHSI are contracts which have not yet closed and why it is considered a future housing indicator. From the NAR:
NAR's Pending Home Sales Index (PHSI) is released during the first week of each month. It is designed to be a leading indicator of housing activity.
The index measures housing contract activity. It is based on signed real estate contracts for existing single-family homes, condos and co-ops. A signed contract is not counted as a sale until the transaction closes. Modeling for the PHSI looks at the monthly relationship between existing-home sale contracts and transaction closings over the last four years.
We had earlier a report where 33% of contracts were cancelled. Additionally, as we can see from the above graph, the PHSI has been higher after the housing bubble burst, so people believing magically all is well with the housing market from this report are in fantasy land.
Part of the headline buzz problem is this statement from NAR economist Lawrence Yun:
With a sustained downtrend in unsold inventory, this would bring about a broad price stabilization or even modest national price growth, of course with local variations.
We just saw Case-Shiller crash and burn for home prices. Sorry Dr. Yun, but the below quote sounds like wishful thinking, unemployment is still over double what it should be and new jobs are paying about 17.5% less.
If and when credit availability conditions return to normal, home sales will likely get a 15 percent boost, speed up the home-price recovery, and thereby significantly reduce the number of homeowners who are underwater.
That's a lot of ifs. Additionally, Dr. Yun's claim rents are rising is just plain wrong. Additionally, the median price is still out of reach for a family of 4 with today's wages.
With that, cheerleading squad, one might look at the data, the revisions and other details before placing yer bets in those great gambling casino chips which are dependent upon residential housing sector.
Recent comments