
NAR tries to spin pending home sales' -5.5% annualized monthly decline. This is the largest monthly percentage drop in a year.
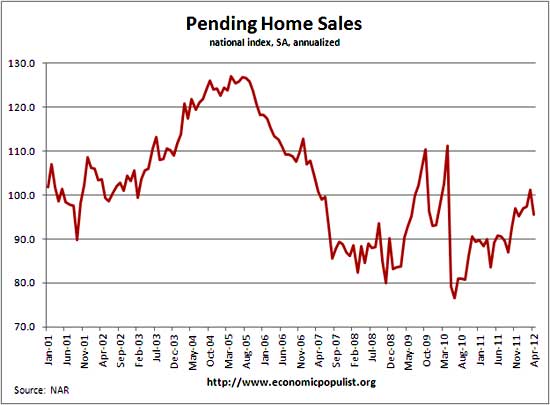
As we can see from the above graph, pending home sales are really around the 2002 levels, as are other housing stats. Yet here is NAR's statement on April's pending home sales:
Pending home sales retrenched in April following three consecutive monthly gains, but are notably higher than a year ago, according to the National Association of Realtors®.
The Pending Home Sales Index,* a forward-looking indicator based on contract signings, declined 5.5 percent to 95.5 from a downwardly revised 101.1 in March but is 14.4 percent above April 2011 when it was 83.5.
Last month we saw the same thing, the housing bust is over and the market is recovering, but last month was based on the monthly increase.
The NAR Pending Home Sales Index is based on contract signings and indicates actual sales a couple of months later. Pending Home sales are not actual closings.
As we can see from the above historical graph, pending home sales have been higher, right in the middle of the housing bust, mainly due to the first time home buyer's tax credit. Ignoring that anomaly, we see pending homes sales more around 2002-2003 levels. Here is NAR's regional data breakdown:
The PHSI in the Northeast rose 0.9 percent to 78.9 in April and is 19.9 percent higher than April 2011. In the Midwest the index slipped 0.3 percent to 93.0 but is 23.0 percent above a year ago. Pending home sales in the South fell 6.8 percent to an index of 105.7 in April but are 13.3 percent higher than April 2011. In the West the index dropped 12.0 percent in April to 94.9 but is 5.1 percent above a year ago.
Contracts maybe signed but as of late, many do not make it to final sale. From the existing home sales report, we have NAR now refusing to publish the percentage of contracts cancelled, claiming often another contract is offered after a cancellation. In other words, we don't know how many of these pending sales will actually go through. In January 2012 one third of contracts were cancelled.
This index is based on 20% of existing home sales. It helps to also know what the pending home sales index is normalized to, 2001. Think about the U.S. population growth since 2001.
An index of 100 is equal to the average level of contract activity during 2001, which was the first year to be examined as well as the first of five consecutive record years for existing-home sales; it coincides with a level that is historically healthy.
We've seen this headline buzz before and NAR's housing forecast is so pipe dreamin', well, go to their website to read it. Literally they dismiss the CBO's recent warning, the United States will sink into recession. Meanwhile in reality land, an astounding number of homes are underwater.
The PHSI are contracts which have not yet closed and why it is considered a future housing indicator. From the NAR:
NAR's Pending Home Sales Index (PHSI) is released during the first week of each month. It is designed to be a leading indicator of housing activity.
The index measures housing contract activity. It is based on signed real estate contracts for existing single-family homes, condos and co-ops. A signed contract is not counted as a sale until the transaction closes. Modeling for the PHSI looks at the monthly relationship between existing-home sale contracts and transaction closings over the last four years.
We just saw Case-Shiller hit new record lows for home prices. The Census showed new home sales increased, but this report has a large margin of error.
While NAR continues to forever claim a recovery is around the corner, other analyists note mortgages are at record lows and that has failed to revive the housing market.
Bottom line the housing market is uneven, rolling around levels from a decade ago and anyone trying to claim the U.S. will return to 2006 is smokin' crack.
Recent comments