
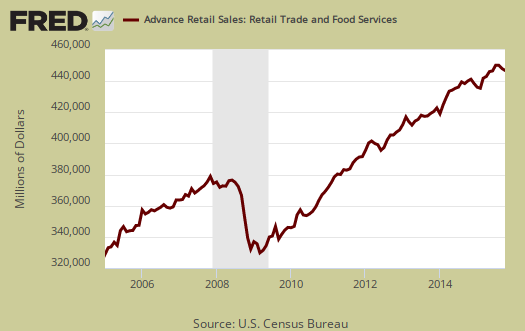
The October 2015 Retail Sales report shows retail sales increased 0.1% for the month as auto sales slid by -0.5%. Without autos & parts sales, retail sales increased 0.2%. Gasoline sales declined by -0.9%. Gasoline sales have plunged by 20.1% from a year ago. Declining gasoline sales are not responsible for such weak consumer demand, for without gas stations considered, retail sales only rose by 0.1%. Retail sales have now increased 1.7% from a year ago. Retail sales are reported by dollars, not by volume with price changes removed. Retail trade sales are retail sales minus food and beverage services and these sales had no change for the month. Retail trade sales includes gas.
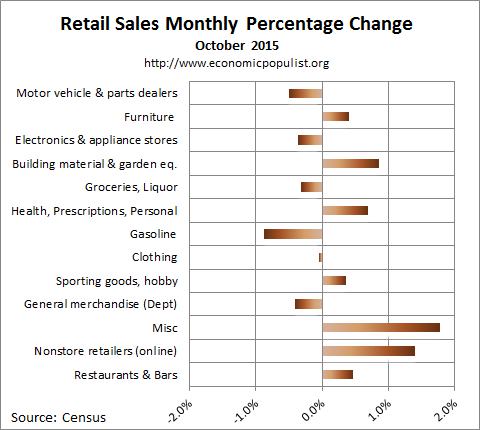
Total October retail sales were $447.3 billion. Below are the retail sales categories monthly percentage changes. These numbers are seasonally adjusted. General Merchandise includes Walmart, super centers, Costco and so on. Department stores by themselves saw a 0.3% monthly sales increase. Building materials increased 0.9%, perhaps on people investing more in their homes once again. Various store retailers had a good month with a 1.8% monthly gain. Online shopping continues to grow with a monthly increase of 1.4% and an annual gain of 6.7%. Food and drinking retail sales has gained 6.6% for the year.
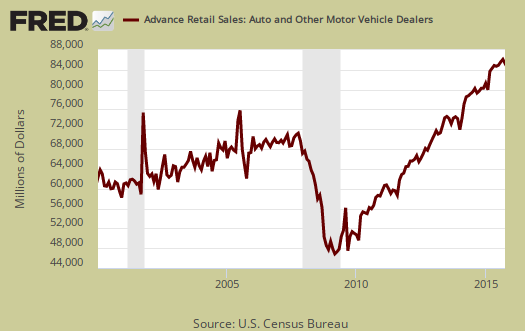
Below is a graph of just auto sales. For the year, motor vehicle sales have increased 6.7%. Autos & parts together have increased 6.2%
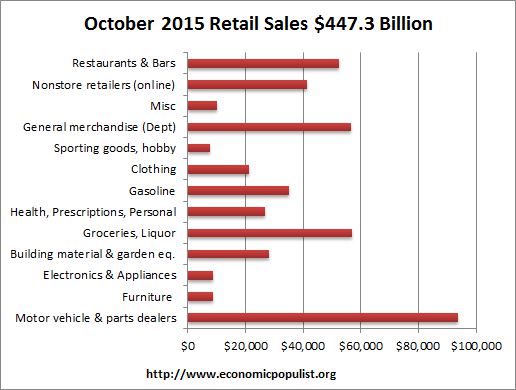
Below are the retail sales categories by dollar amounts. As we can see, autos are by far the largest amount of retail sales. Autos and parts is more than groceries and almost rivals groceries, bars and restaurants combined.
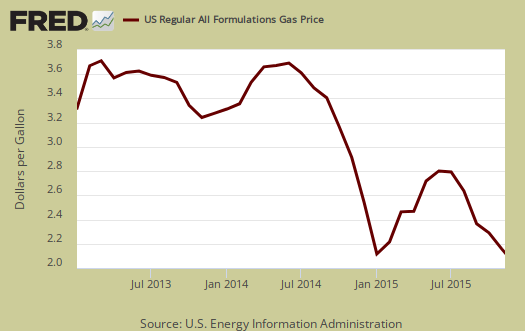
Graphed below are weekly regular gasoline prices and as prices drop, so do retail sales.
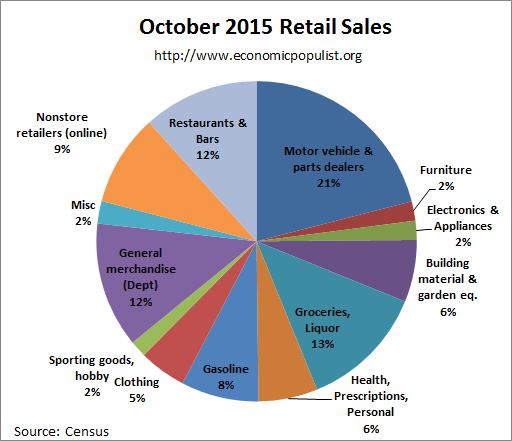
The below pie chart breaks down the monthly seasonally adjusted retail sales by category as a percentage of total sales by dollar amounts. The size of auto sales in comparison to all else never ceases to amaze.
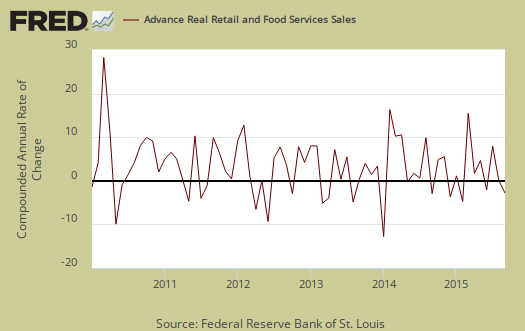
Retail sales correlates to personal consumption, which in turn is about 70% of GDP growth. Yet GDP has inflation removed from it's numbers. This is why Wall Street jumps on these retail sales figures. Below is the graph of retail sales in real dollars, or adjusted for inflation, so one gets a sense of volume versus price increases. Below is the annualized monthly percentage change in real retail sales, monthly, up to September 2015. This is a crude estimate since CPI is used instead of individual category inflation indexes.
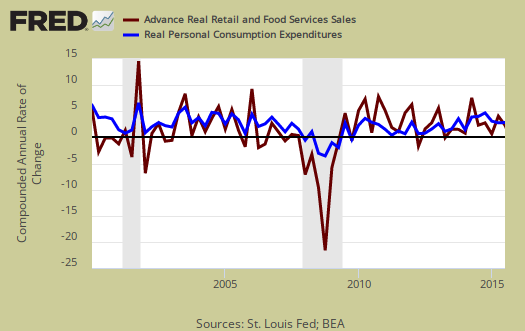
Below is a graph of real PCE against real retail sales, quarterly, up to Q3 2015. See how closely the two track each other? PCE almost looks like a low pass filter, an averaging, removal of "spikes", of real retail sales. Here are our overviews for PCE. Here are our overviews of GDP.
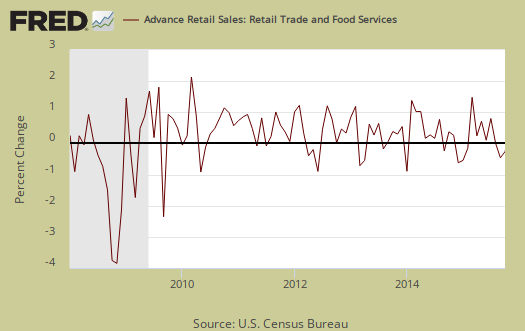
Retail sales are not adjusted for price increases, not reported in real dollars. Real economic growth adjusts for inflation. Retail sales has variance, margins of error, and is often revised as more raw data comes into the U.S. Department of Commerce (Census division). For example, this report has an error margin of ±0.5%. Data is reported via surveys, and is net revenues of retail stores, outlets. Online retail net revenues are asked in a separate survey of large retail companies (big box marts). This is also the advanced report. To keep the monthly nominal percentage changes in perspective, below is the graph of monthly percentage changes of retail sales since 2008.
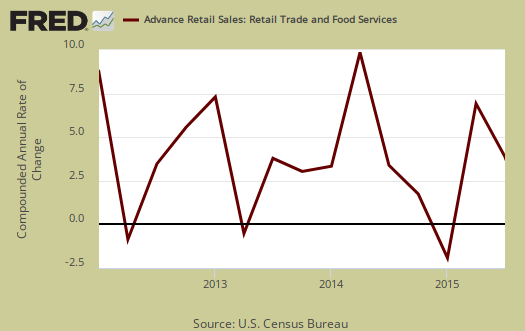
For the three month moving average, from January August to October in comparison to the May through July average, retail sales have increased by 0.5%. The retail sales three month moving average in comparison to a year ago is up 2.0%. Overall as shown the below graph of quarterly annualized retail sales percentage change, up to Q3 2015. Adjusted for prices and inflation is what matters for economic growth. While this is the 1st month of Q4, it does not bode well to be positive since inflation probably increased more than retail sales in October.
Advance reports almost always are revised the next month as more raw sales data is collected by the Census. In other words, do not get married to these figures, they will surely be revised and seasonal adjustments are aggregate.
Here are past retail sales overviews, unrevised.
revisions to retail sales
September's seasonally adjusted sales were revised from the $447.7 billion first reported to $447.0 billion, while August's sales, which were revised down to $447.2 billion from the originally reported $447.7 billion last month, were revised down again, to $447.1 billion with this report, resulting in an advance sales figure nearly 0.1% lower than was reported last month...
rjs