
Both oil and natural gas prices moved higher last week, as both commodities saw larger than expected withdrawals of supplies from storage, while oil prices were also underpinned by expectations that OPEC would extend their production cuts when they meet in Vienna later this month. An expression of confidence in that extension from Saudi energy minister Khalid al-Falih on Monday buttressed the rebound from last week's crash, as oil rose 21 cents to close at $46.43 a barrel. Prices then moved lower on Tuesday, closing at $45.88 a barrel, after the EIA raised its forecast on domestic crude output for this year and next, and cut its 2017 price outlook. However, when the weekly EIA report showed the largest crude oil inventory draw since December, oil prices surged as much as 4% before settling at $47.33 a barrel, a gain of 3% on the day. Momentum from that rally carried into Thursday, as oil added 50 cents more to close at $47.83 a barrel, on news that top OPEC officials were pondering even deeper cuts. Oil prices then slipped on Friday, after Baker Hughes reported the US oil rig count rose for the 17th straight week, but stabilized by the end of the day, with June crude closing at $47.84 a barrel, up a penny for the session and up 3.5% for the week..
OPEC's May oil report
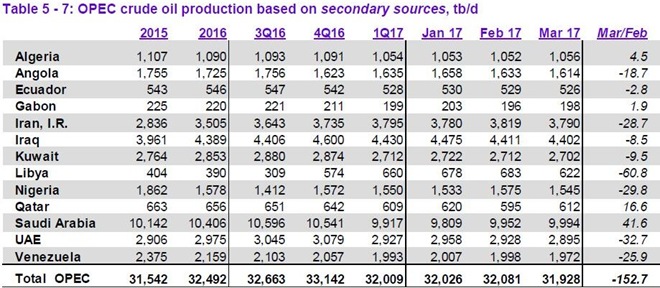
Since the OPEC production cuts are the main factor underpinning oil prices, and hence the ongoing increases in US drilling, we'll start by taking a quick look at OPEC May Oil Market Report (covering April OPEC & global data), which was released on Thursday of last week. We're going to look at how much oil OPEC produced in April vis a vis global production, and then determine if they are yet meeting their intended outcome of reducing the global glut of oil that's been building up over the past three years, as most OPEC countries were producing flat out over that period. The first table from the May report that we'll include here is from page 60 of that OPEC pdf, and it shows oil production in thousands of barrels per day for each of the current OPEC members over the recent years, quarters and months as the column headings are labeled. For all their official production measurements, OPEC uses data from these "secondary sources", such as analyst's reports from satellites and shipping data, as an impartial adjudicator as to whether their output quotas and production cuts are being met, to resolve any potential disputes that could arise if each member reported their own figures.

From this table of official production data, we can see that OPEC oil output was down by a statistically insignificant 18,200 barrels per day in April, to 31,732,000 barrels per day, from a March oil production total of 31,750,000 barrels per day, a figure that was revised 178,000 barrels per day lower than what was reported last month. (for your reference, here is the table of the official March figures before these revisions) Recall that OPEC committed to reducing their production by 1.2 million barrels per day from their October levels (shown here, with Indonesia, who is no longer a member), so these figures show that the total production of the remaining 13 members is within a half percent of the level they agreed to cut back to. But note that over 60 thousand barrels of this month's reduction came from Libya, a country that was exempt from the cuts, because their production had been disrupted by domestic unrest. News over the past few weeks indicates they've restored over 180,000 barrels per day of production from two oil fields in the western part of the country, and a report just a few days ago indicated that Libya’s oil production is now running above 800,000 barrels per day (bpd) for the first time since 2014, so we can thus expect that May OPEC production figures will be that much higher...
The expected output bounce in the May report notwithstanding, there were also interesting divergent April production figures that the OPEC members reported to the OPEC Secretariat, which are shown in the next table...

The above table, also from page 60 of the OPEC pdf, shows the oil production in thousands of barrels per day that each of the members reported to OPEC (for those that did report). Although this data is always considered suspect because of the many incentives OPEC members have to fudge their reports, we noticed that almost all the OPEC members reported higher production than was attributed to them by the official secondary sources. Note especially that Iraq, who has been a laggard on the production cuts, reported they produced 4,531,000 barrels per day in April, vs their official figure of 4,373,000 barrels per day. Likewise, Venezuela reported that they produced 2194,000 barrels per day in April, whereas the official data indicates they produced 1,956,000 barrels per day. If the reported numbers were lower than the official tallies, they might be suspect, but OPEC members have no reason to report that they produced more than they did, because higher oil output numbers would indicate that they're not in compliance with the cuts they agreed to. So if anything, these self reported number indicate that the official output production figures may be an understatement of the oil supply that was actually available in April...
This next graphic shows us both OPEC and world oil production monthly on the same graph, over the period from May 2015 to April 2017, and it comes from page 61 of the May OPEC Monthly Oil Market Report. The light blue bars represent OPEC oil production in millions of barrels per day as shown on the left scale, while the purple graph represents global oil production in millions of barrels per day, with the metrics for global output shown on the right scale...

Preliminary data graphed above indicates that global oil production slipped to 95.81 million barrels per day in April, down by 0.41 million barrels per day from a March total of 96.22 million barrels per day, which was revised .040 million barrels per day higher from the 95.81 million barrels per day global oil output that was reported a month ago. That figure was also 0.83 million barrels per day higher than what was being produced globally a year ago, and more than .90 million barrels per day greater than the global oil supply of two years ago. OPEC's production of 31,732,000 barrels per day thus represented 33.1% of what was produced globally, an increase from the 33.0% OPEC share in March, which was originally reported as 33.3%, because global supply had been underestimated last month. OPEC's April 2016 production, excluding Indonesia, was at 31,709,000 barrels per day, so even after the production cuts, they are still producing a bit more than they were producing a year ago, and roughly 0.20 million more barrels per day than what they were producing in May of 2015, when they were supposedly producing flat out.
However, even with the four recent months of production cuts we can obviously see on the above graph, there is still a surplus of oil supply being produced globally, as the next table that we'll include will show us..

The table above comes from page 37 of the May OPEC Monthly Oil Market Report, and it shows oil demand in millions of barrels per day for 2016 in the first column, and OPEC's forecast for oil demand by region and globally over 2017 over the rest of the table. On the "Total world" line of the third column, we've circled in blue the figure we're interested in, which is their estimate for global oil demand for the current second quarter of 2017...
OPEC's estimate is that during the 2nd quarter of this year, all oil consuming areas of the globe will be using 95.33 million barrels of oil per day, down from the 95.44 millions of barrels of oil per day that were used in the first quarter but up from the 95.12 millions of barrels of oil per day that were used in 2016. But as OPEC showed us in the oil supply section of this report and the summary supply graph above, even with their production cuts, the world's oil producers were still producing 95.81 million barrels per day during April. That means that even after all the production cuts have taken place, there continued to be a surplus of around 480,000 barrels per day in global oil production in April. In addition, global production for March was revised higher in this report, to 96.22 million barrels per day, so that means the global oil surplus during March was therefore around 780,000 barrels per day, based on the revised first quarter global demand figure of 95.44 million barrels per day shown above. Furthermore, February's oil production was 0.23 million barrels per day higher than that of March, so the global oil surplus in February now looks to have been over a million barrels per day, as was January's, which we showed when we reviewed that report three months ago. So despite 4 months of OPEC production cuts, nearly a hundred million barrels of oil have been added to the global oil glut since the 1st of the year.
Note: the above was excerpted from my weekly synopsis at Focus on Fracking
Recent comments