
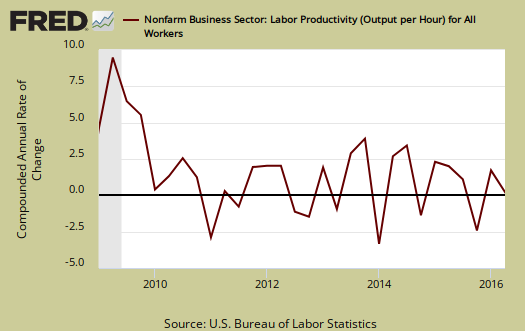
The BLS Productivity & Costs report for Q2 2016 shows labor productivity decreased -0.5% annualized. Output increased 1.2% and hours worked increased 1.8%. Unit Labor costs increased only 0.5% in Q2 2015. The reason labor productivity declined was because economic output grew less than worked hours. For the 2015 year, annual productivity rose 0.9%. For 2014, annual productivity was 0.8% and in 2013, 0.3%. The average annual rate of productivity growth from 2007 to 2015 was 1.3%. This is far below the long term 1947 to 2015 annual rate of 2.2%.
The basic equation for labor productivity is: , where
is the total output of industry and
stands for labor.
Output can be thought of what is produced from the fruits of labor. Examples would be the cars which come off the assembly line and burgers & fries being served up at the greasy spoon. Here is the BLS labor productivity formula:
Labor productivity is calculated by dividing an index of real output by an index of the combined hours worked of all persons, including employees, proprietors, and unpaid family workers.
, or Labor, is measured in hours only. Nonfarm Business Output directly correlates to real GDP, minus the government, farms,all of those nonprofits and our infamous, often illegal nannies and gardeners, and equivalent rent of owner occupied properties. The output, or
is about 74% of real GDP reported. Farms only represent about 1% of output in today's economy. Labor productivity is reported as annualized figures and both indexes are normalized to the year 2009. The main productivity numbers above are all business, no farms, where labor costs have a high ratio, about 60%, to output. These productivity statistics are referred to as nonfarm business.
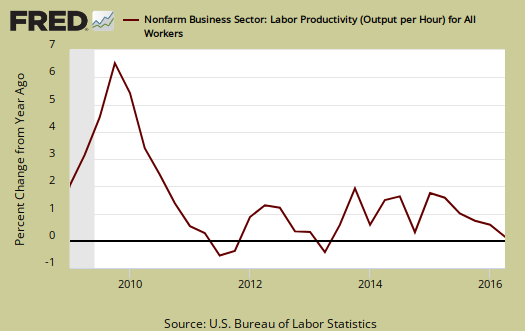
From a year ago, Q2 2015, productivity has declined -0.4%. This is the first decline of four quarters since 2013. Output increased 1.1%, and hours worked rose by 2.1%. The increase in hours works as the cause of declining productivity are a good thing. Workers have been arbitraged to death and slave driven since the recession, so we take these figures as working conditions have slightly improved. Labor productivity changes from a year ago is shown in the below graph.
BLS defines unit labor costs as the ratio of hourly compensation, to labor productivity, where is compensation
represents hours worked as above, or:
For more formula definitions see the BLS handbook. One can also view unit labor costs as the ratio of total worker financial compensation to economic output, adjusted for inflation. Below is the report description of the ratio relationship:
BLS defines unit labor costs as the ratio of hourly compensation to labor productivity; increases in hourly compensation tend to increase unit labor costs and increases in output per hour tend to reduce them. Real hourly compensation is equal to hourly compensation divided by the consumer price series.
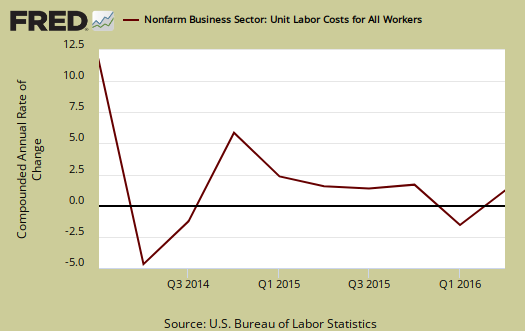
Graphed below are unit labor costs, compounded annual rate, percent change. Nonfarm business unit labor costs increased by 2.0% for Q2 2016. From a year ago, Q2 2015, labor costs are up 2.1%. Increases in unit labor costs imply compensation is finally bumping up instead of flat wages and squeezing workers for more work for the same pay. Increased productivity, or output per hour, for the same $$ paid to workers for more work would lower unit labor costs.
Graphed below are unit labor costs, indexed to 2005. We can see the decline correlating to the Great Recession. One can also see the recovery in more recent years, yet it has taken until 2016 to see any real movement showing up in wages and thus catch up to where they should be has a long way to go. Q2 hourly compensation, not adjusted for inflation, increased 1.5% and for the year to year rate, increased 1.7%. This shows most of the increase in pay happens in the second quarter.

Real hourly compensation is wages adjusted for inflation. Real hourly compensation is equal to hourly compensation, defined above, divided by a special inflation series called the consumer price series*, , or:
In terms of real dollars, adjusted for inflation, we have a -1.1% decrease in real hourly compensation for Q2 2016, non-farm businesses. This is actually some worse news as in spite of the rising unit labor costs, real wages have not kept up with inflation. In comparison to Q2 2015, real hourly compensation increased 0.6%. This means wages from a year ago have just barely kept up with inflation. Below are quarterly changes to hourly compensation, adjusted for consumer prices.
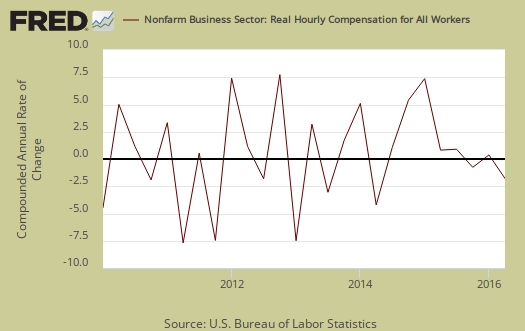
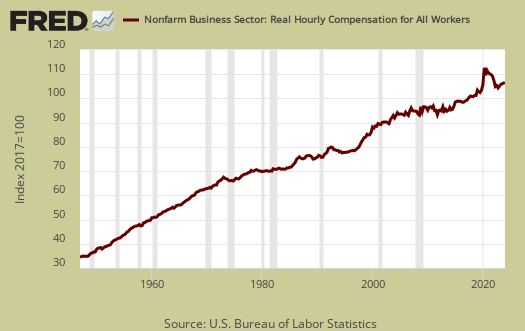
Below is a historical graph of real hourly compensation for nonfarm business. What this shows is a great worker pay squeeze, extensively from 2007 to 2013. It is no wonder why a living wage is such a large national issue.
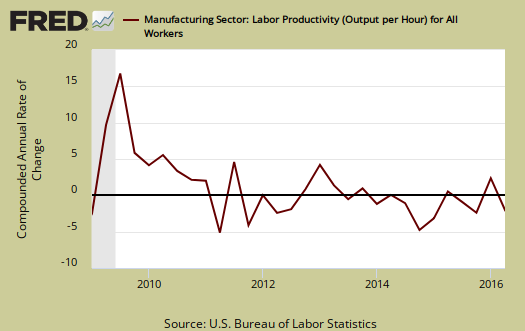
The BLS also reports separately on manufacturing productivity, but uses a different calculation method than the one for business productivity. One cannot subtract manufacturing from business and get services productivity, the two are not the same. Manufacturing is sales, removing duplicates, adjusting for prices and output () is correlated to shipments and the industrial production. indexes. Hours are hours like above. The report has the manufacturing productivity measurement details.
Manufacturing productivity decreased -0.2%, for Q2 2016. Manufacturing output grew by 0.8%, while hours worked rose by 0.7%. Since Q1 2015, manufacturing productivity increased 0.9% as output increased by 0.3% and hours worked showed a -0.6% decrease.
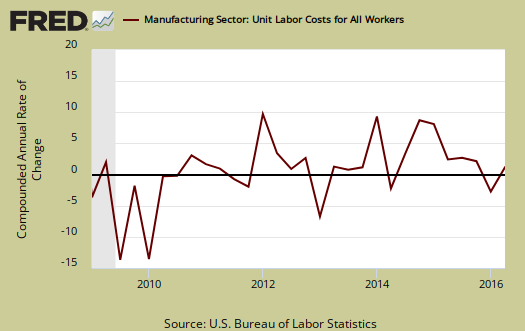
Manufacturing unit labor costs increased by 3.1% for Q2 2016. From Q2 2015, manufacturing unit labor costs have increased by 1.7%.
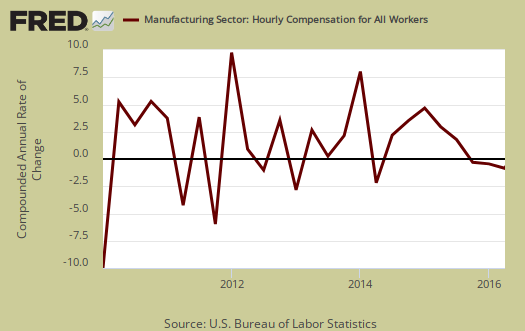
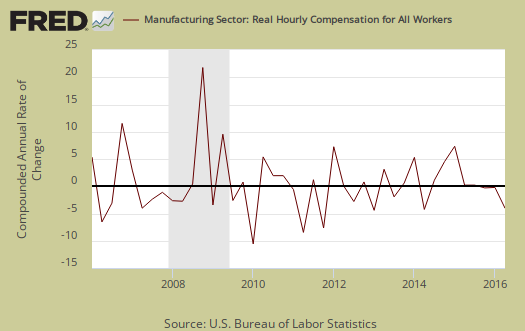
Compensation for manufacturing workers increased 2.9% for the quarter and from a year ago has increased 2.6%. While it might seem we're seeing some movement in manufacturing wages but Q1 2016 compensation nose dived by -4.6%, so we will have to wait until Q4 2016 at least to see if the momentum on compensation increases holds.
Q2 2016 real compensation (wages adjusted for inflation) in manufacturing rose by 0.4%. From Q2 2015, real hourly compensation for manufacturing workers increased by 1.5%. Manufacturing wages for Q1 are clearly under attack as real compensation for 1st quarter 2016 plunged by -4.3%.
For Q2 2016, durable good manufacturing productivity grew by 2.6%, output increased 0.5% and hours worked declined by -2.0%. Durable goods labor unit costs dropped by -0.1%, compensation increased 2.4%. Real compensation decreased by -0.1%. Graphed below is the durable goods manufacturing real hourly compensation index and marvel at the decline over time.
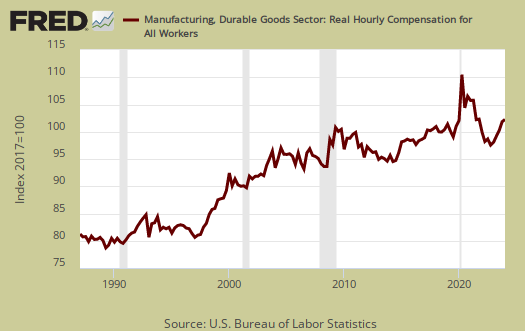
Unit labor costs in durable goods shows the decline of the American worker and are shown below. Unit labor costs show real output per hour. Durable goods workers are producing more and more and U.S. workers are getting less of the reward for their efforts.

Nondurable manufacturing productivity decreased by -4.1% on an output slid by -2.4%. Hours worked increased by 1.8%. Nondurable manufacturing unit labor costs increased by0.7%, hourly compensation increased by 4.2% and real hourly compensation increased by 1.6%. From Q2 2015, productivity was 0.3%, output was 0.3% and real hourly compensation rose by 2.3% in nondurable manufacturing.
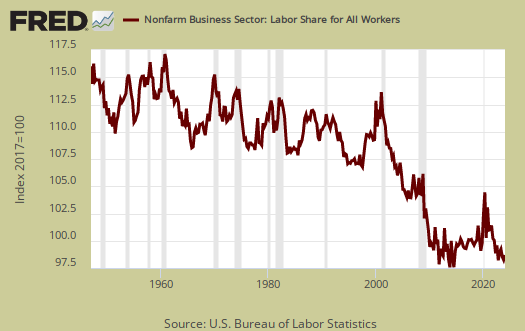
Labor share is a measure of how much of the economic pie goes to workers. If labor share increases, this implies labor is benefiting from increased economic growth. When the compensation to productivity gap widens, labor share falls and that means workers are not reaping the economic rewards of their sweat and toil. Below is labor market share for nonfarm business which shows workers overall are getting less and less of the productivity pie, although things have picked up in recent years.
Overall, the labor productivity statistics for Q2 2016 look like workers are finally getting a little bit of a break. While the American worker i still not getting enough of the economic pie, at least their share isn't still plunging. The long term productivity figures will never been seen again due to globalization and technological shifts. Unless U.S. trade policy and wages are completely revamped, it sure appears the days of the middle class manufacturing worker are long gone.
* The BLS productivity statisticians use CPI-U-RS, an unpublished inflation research metric, for the consumer price series. This consumer price series seems to flatten inflation, thus make the decline in U.S. wages less, although when normalized to a base year of 2009 the two series are the same for all practical purposes. The implicit price deflator, applied to nonfarm business output (productivity), is from the BEA. The CPS and the price deflator are all to remove inflation effects from the productivity statistics.
Recent comments