
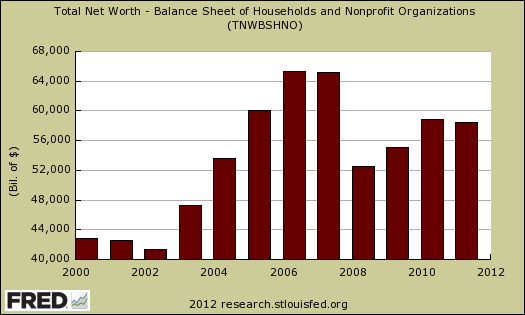
The Q4 2011 Federal Reserve's flow of funds report is more bad news for Americans, plus holds some obscene statistics from corporate America. Household wealth increased $1.191 trillion to $58.455 trillion in Q4 2011, but is down by $369 billion, from Q4, 2010, or -0.63%. In comparison to the end of 2007, household wealth is still down -$6.743 trillion, or -10.34%. Below is a graph of annual household net worth.
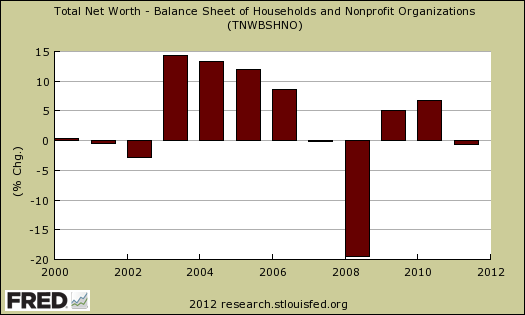
And the percent change from year to year.
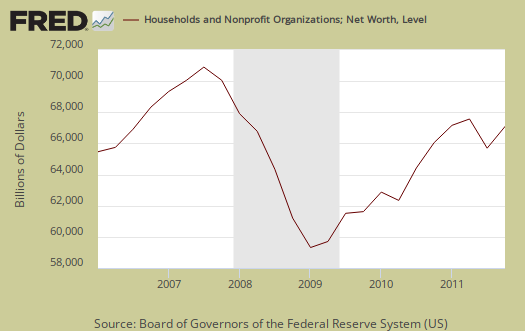
Household net worth—the difference between the value of assets and liabilities—was $58.5 trillion at the end of 2011, about $1.2 trillion more than at the end of the third quarter. For 2011 as a whole, household net worth fell close to ¾ percent, the first annual decrease since 2008.
Below is the graph for household net worth on a quarterly basis, end of period.
One of the most disturbing graph is home equity as part of household net worth. Home equity was $6.123 trillion, but a decline of -$171.4 billion from Q3 20111. As a percentage of total real estate holdings owner equity declined to 38.4% from 38.9% in Q3. Below is the graph for household net worth on a quarterly basis, end of period.

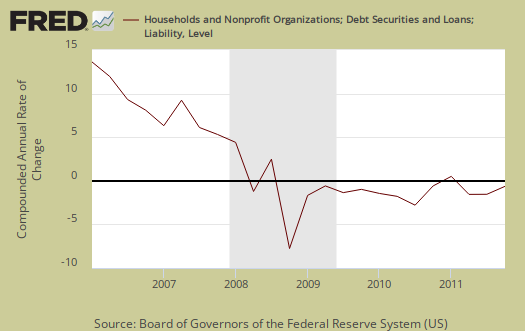
Household debt increased, 0.3% annualized, the first increase in 3 years, while consumer credit increased the most in 7 years.
Household debt increased at an annual rate of ¼ percent in the fourth quarter, the first increase since the second quarter of 2008. Consumer credit rose at an annual rate of 7 percent in the fourth quarter, the fifth consecutive quarterly increase. Home mortgage debt declined 1½ percent in the fourth quarter, the smallest decline since the end of 2009.
Now here is the statistic which should outrage you. Corporate cash, liquid assets hit another record high and a 5.1% increase from last quarter to a whopping $2.233 trillion bucks. That's cash these same corporations could be using to build factories, plants, R&D centers in the United States, use to hire Americans, even fund a few scholarships for Americans. Instead over $2.233 trillion is sitting in their greedy vaults. Some are pointing to quantitative easing giving corporations so much cash.
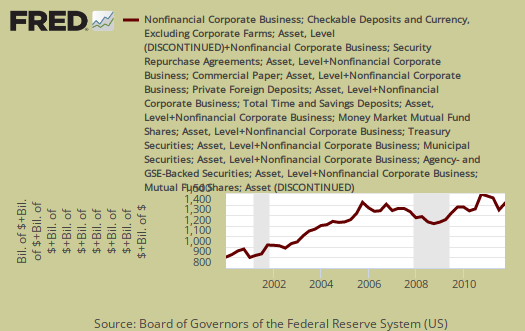
Now the flow of funds is impossible to read and over 100 pages. There, I said it. So you might be interested to know exactly what is meant by businesses are sitting on a butt load of cash that the press reports but does not explain.
The report is for incorporated businesses which are not financial or farms. That excludes insurance companies too. Then, liquid assets are also referred to as cash. Why? Because this stuff is easily turned into currency or directly represents currency, such as time deposits. What does the Fed classify nonfarm, nonfinancial businesses' assets as liquid? The list is: municipal securities and loans, commercial paper, checkable deposits and currency, total time and savings deposits, money market mutual fund shares, total U.S. government securities, private foreign deposits, federal funds security repurchase agreements, and mutual fund shares.
In the flow of funds report, you can find total liquid assets on line 41, p. 67, L.102 Nonfarm Nonfinancial Corporate Business table.
playing catch up
This report actually came out yesterday and wanted to point out a couple of things with graphs not amplified as much in the press. The amount of cash corporations are sitting on is obscene and making corporate profits off of U.S. Treasuries, quantitative easing and so on isn't exactly production.