
Q4 GDP 2011 was revised from 2.8% to 3.0%.. Here is the original BEA GDP report. Less imports than originally estimated gave the biggest boost to the Q4 GDP revision. Quarterly GDP is reported annualized.
Q4 GDP saw an sharp increase in private inventories build up, part of investment, and a decrease in government spending. Personal consumption also increased as did imports.
As a reminder, GDP is made up of:
where Y=GDP, C=Consumption, I=Investment, G=Government Spending, (X-M)=Net Exports, X=Exports, M=Imports*.
Here is the Q4 2011 second revision, GDP by percentage point contributions. Without rounding, Q4 GDP was 2.99%.
- C = +1.52
- I = +2.42
- G = –0.89
- X = +0.59
- M = –0.65
Here is the Q4 2011 advance report breakdown of GDP by percentage point contributions. The BEA rounds to one decimal place, Q4 GDP was actually 2.76%
- C = +1.45
- I = +2.35
- G = –0.93
- X = +0.64
- M = –0.75
Below are the percentage point differences, or spread between the Q4 advance and Q4 2011 GDP second report components. This represents the difference between revisions.
- C = +0.07
- I = +0.07
- G = +0.04
- X = -0.05
- M = +0.10
Below is a table summarizing the revisions.
| Comparison of the Q4 GDP Component Revisions | |||
|---|---|---|---|
| Component | Second Revision | Advance | Spread |
| GDP | +2.99 | +2.76 | +0.23 |
| C | +1.52 | +1.45 | +0.07 |
| I | +2.42 | +2.35 | +0.07 |
| G | –0.89 | –0.93 | +0.04 |
| X | +0.59 | +0.64 | -0.05 |
| M | –0.65 | –0.75 | +0.10 |
Changes in private inventories were revised from +1.94 to +1.88 Q4 2011 GDP percentage points. Changes in private inventories now represents 62.9% of Q4 GDP growth. Companies increase inventories when they believe demand for their products will be picking up. Inventories can also build up when producers made more stuff they thought would sell.....but didn't.

Yes folks, government consumption and investments does add to U.S. economic growth in spite of the rhetoric one hears. This quarter government subtracted off -0.89 percentage points, or -23% from Q4's GDP. Federal spending subtracted off –0.58 percentage points and State spending resulted in a negative –0.30 percentage point contribution to GDP. Federal national defense spending was the biggest drop, with a –0.70 percentage point GDP contribution. Below is the percentage quarterly change of government spending, adjusted for prices, annualized.

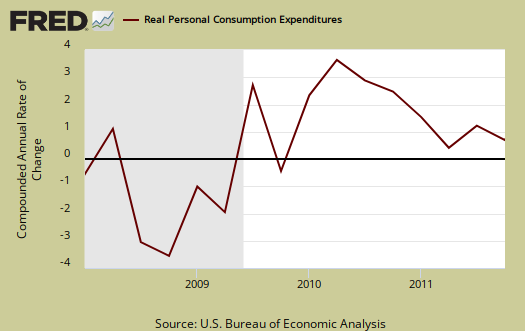
Below the the St. Louis FRED graph for C, or real personal consumption expenditures of the above GDP equation. As we can see from the above, PCE, or C in the above equation, wasn't the real reason for stronger GDP growth in Q4.
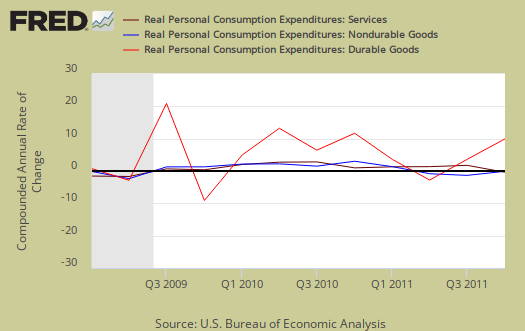
Below is the breakdown in C or real PCE annualized change. The forth quarter PCE percentage point breakdown was a +0.35 percentage point contribution in services, goods was +1.17 with durable goods being most of goods, or a +1.10 percentage point contribution to GDP. Notice when times are tough, durable goods (bright red in the below graph) consumption drops. Where people spent their money was motor vehicles and parts, a +0.81 percentage point contribution to GDP. Housing and utilities was –0.35 percentage points of Q4 GDP and yes these are adjusted for inflation using CPI. In real dollars housing and utilities were consumed less in Q4. PCE is often revised from the advance report as receipts and reports are collected. Below is PCE with the quarterly annualized percentage change breakdown of goods versus services (maroon).
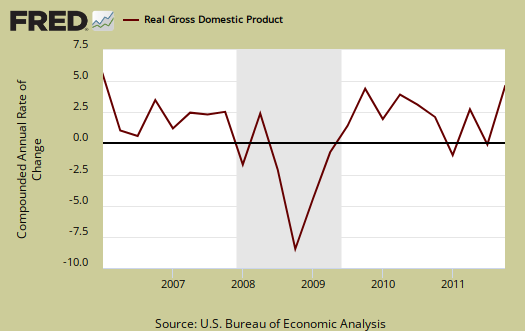
Below are real final sales of domestic product, or GDP - inventories change. This gives a better feel for real demand in the economy. This is because while private inventories represent economic activity, the stuff is sitting on the shelf, it's not demanded or sold. Real final sales were revised upward in the Q4 GDP 2nd estimate, from 0.8% to 1.1%, which shows some slightly better news than the Q4 advance GDP estimate. In Q3 real final sales was 3.2%.

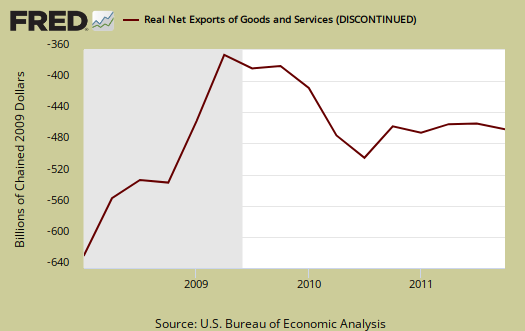
Below are net exports, or the trade deficit, in real chained dollars, for Q4 2011. Imports subtract from gross domestic product.
The below graph shows real imports vs. exports. Exports were revised downward yet imports more. It is the trade deficit that matters for GDP. Trade data isv almost always revised from the advance GDP report as Census trade data comes in from customs.

Gross domestic purchases are what U.S. consumers bought no matter whether it was made in Ohio or China. It's defined as GDP plus imports and minus exports or using our above equation: where P = Real gross domestic purchases. Real gross domestic purchases were revised upward from +2.8% to +2.9% in the Q4 GDP 2nd estimate. Exports are subtracted off because they are outta here, you can't buy 'em, but imports, as well a know all too well, are available for purchase at your local Walmart. When gross domestic purchases exceed GDP, that's actually bad news, it means America is buyin' imports instead of goods made domestically. As we can see, GDP and gross domestic purchases are almost equal.
Below are the percentage changes of Q4 2011 GDP components, from the advance and this 2nd revision. Realize there is a difference between percentage change and percentage point change. Point change adds up to the total GDP percentage change and is reported above. The below is the individual quarterly percentage change, against themselves, of each component which makes up overall GDP.
Second Revision:
- C = +2.1%
- I = +20.6%
- G = –4.4%
- X = +4.3%
- M = +3.8%
Advance Report:
- C = +2.0%
- I = +20.0%
- G = –4.6%
- X = +4.7%
- M = +4.4%
The BEA's comparisons in percentage change breakdown of 2nd quarter GDP components are below. Changes to private inventories is a component of I.
C: Real personal consumption expenditures increased 2.1 percent in the fourth quarter, compared with an increase of 1.7 percent in the third. Durable goods increased 15.3 perc ent, compared with an increase of 5.7 percent. Nondurable goods increased 0.4 percent, in contrast to a decrease of 0.5 percent. Services increased 0.7 percent, compared with an increase of 1.9 percent.
I: Real nonresidential fixed investment increased 2.8 percent, compared with an increase of 15.7 percent. Nonresidential structures decreased 2.6 percent, in contrast to an increase of 14.4 percent. Equipment and software increased 4.8 percent, compared with an increase of 16.2 percent. Real residential fixed investment increased 11.5 percent, compared with an increase of 1.3 percent.
X & M: Real exports of goods and services increased 4.3 percent in the fourth quarter, compared with an increase of 4.7 percent in the third. Real imports of goods and services increased 3.8 percent, compared with an increase of 1.2 percent.
G: Real federal government consumption expenditures and gross investment decreased 6.9 percent in the fourth quarter, in contrast to an increase of 2.1 percent in the third. National defense decreased 12.1 percent, in contrast to an increase of 5.0 percent. Nondefense increased 4.4 percent, in contrast to a decrease of 3.8 percent. Real state and local government consumption expenditures and gross investment decreased 2.5 percent, compared with a decrease of 1.6 percent.
Motor Vehicles GDP contribution was significantly revised, from +0.30 to +0.43 Q4 real GDP percentage points . Computer final sales was revised downward, from +0.18 to +0.12 percentage point changes. Motor vehicles are different from personal consumption, or C sub-component auto & parts. Motor vehicles, computers are bought as investment, as fleets, in bulk, by the government and so forth.
Residential fixed investment was revised slightly, from +0.23 to +0.25 Q4 GDP percentage points. Below is the raw totals on residential investment. If one could ever see the housing bubble and then it's collapse in terms of economic contributions, the below graph is it.

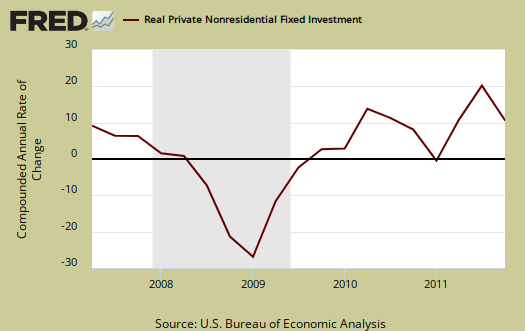
Private, or not from the government, nonresidential fixed investment was revised upward significantly, from +0.18 to +0.29 Q4 GDP percentage point contributions. Structures, a sub-component of nonresidential fixed investment, was the main revision, from –0.21 to –0.07 percentage points while equipment and software was revised down slightly, from +0.39 to +0.36 Q4 GDP percentage points.
The price index was also revised upward, from 0.8% in the advance to 1.1% in the second revision. In other words, more inflation, and thus less real value in comparison to the advance report. Core price index, or prices excluding food and energy products, was revised upward from 1.0% to 1.2% for Q4.
In current dollars, not adjusted for prices, GDP, or the U.S. output, is $15.3208 trillion. Applying the price indexes, or chained, real 2005 dollars, Q4 GDP was $13.4299 trillion. Both numbers are annualized.

Here is the overview for the Q4 2011 GDP, advance report, text unrevised, graphs are updated.
* In Table 2, the BEA reports GDP contribution components with their equation sign. If durable goods for example, decreased over the quarter or year, it is reported as a negative number. Imports, from the GDP equation, are already a negative for that is not something produced domestically. A negative sign implies imports increased for the time period and a + sign means the change in imports decreased. Or, from the GDP equation: . Confusing but bottom line exports add to economic growth, imports subtract.
open to suggestions to make this overview clearer
As you all know, The Economic Populist is infamous for going into great detail as well as a graph-o-rama center.
GDP is actually one of the more complex economic report releases and we've about 1 step away from reading actual BEA tables in this overview.
I'm open to suggestions on how to maintain that nitty-gritty devil detail in the overview, yet try to improve it so it's understandable for most people.
The idea of these overviews is to beat the so often incorrect press buzz headlines but also to offer up some bridge between the actual report and comprehensive English.
Thanks for your suggestions.