
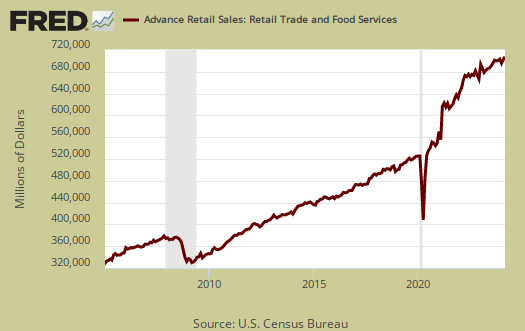
April 2016 retail sales really popped up as auto sales roared. Retail sales increased 1.3% for the month and auto dealers sales surged by 3.5%. Without autos & parts sales, retail sales still had a great showing with a monthly 0.8% gain. Gasoline station sales have also shot up as prices rose, a 2.2% increase for the month. Retail sales have now increased 3.0% from a year ago and all of auto dealer sales for the year were gained in April, 3.5%. Retail sales are reported by dollars, not by volume with price changes removed. Retail trade sales are retail sales minus food and beverage services and trade sales increased by 1.4% for the month. Contrary to the press, retail sales are not consumer spending, although are highly correlated.
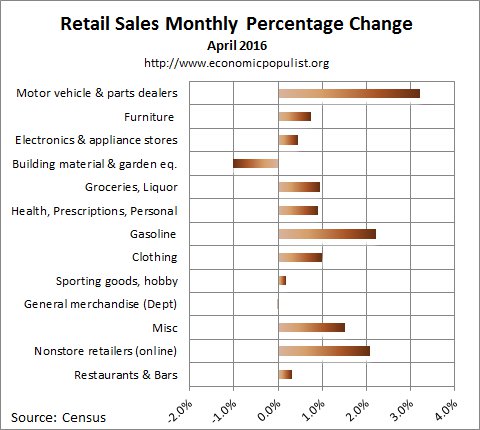
Total April retail sales were $453.4 billion. Below are the retail sales categories monthly percentage changes. General Merchandise includes Walmart, super centers, Costco and so on. Department stores by themselves saw a 0.3% increase from last month. Grocery stores by themselves also surged with a 1.1% monthly sales increase. Building materials and garden supply places had a terrible month with a -1.0% monthly decline. Restaurants and bars increased 0.3% and are up 5.2% for the year. Miscellaneous brick and mortar store retailers saw a 1.5% increase with a 4.7% annual sales gain. Online shopping continues to increase with a whopping 2.1% monthly gain and an annual one of 10.2%. These figures are seasonally adjusted.
Below is a graph of just auto sales. For the year, motor vehicle sales have increased just 3.5%, the same as the April monthly gain. Autos & parts together increased 3.2% for the month and 3.1% from a year ago.

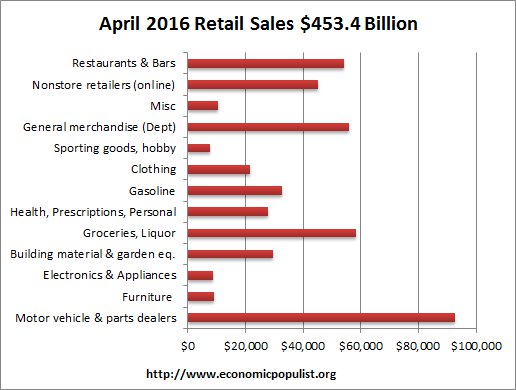
Below are the retail sales categories by dollar amounts. As we can see, autos are by far the largest amount of retail sales. By volume, auto dealers by themselves were $85.4 billion of sales. Grocery stores by themselves are $52.2 billion.
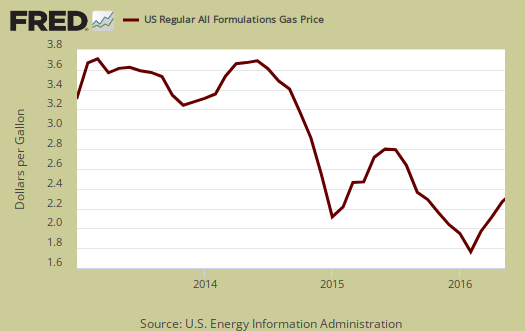
Graphed below are weekly regular gasoline prices, which is strongly correlated to retail sales figures. We can see how prices have increased of recent but there is no indication the party is over on low gasoline prices.
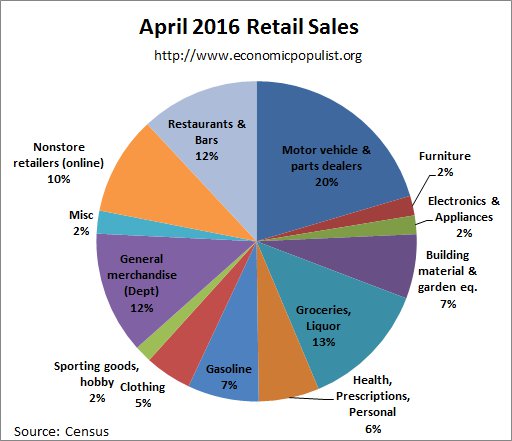
The below pie chart breaks down the monthly seasonally adjusted retail sales by category as a percentage of total sales by dollar amounts. The ratios of what people buy retail have been fairly stable, with online shopping taking more and more of a bite.
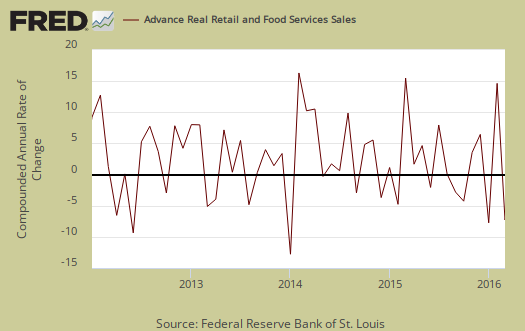
Retail sales correlates to personal consumption, which in turn is about 70% of GDP growth. Yet GDP has inflation removed from it's numbers. This is why Wall Street jumps on these retail sales figures. That said, realize personal consumption expenditures were $11.4 billion annualized when adjusted for inflation. The last month, March of real retail sales is only an annualized $2.3 billion. Below is the graph of retail sales in real dollars, or adjusted for inflation, so one gets a sense of volume versus price increases. Below is the annualized monthly percentage change in real retail sales, monthly, up to March 2016. This is a crude estimate since CPI is used instead of individual category inflation indexes.
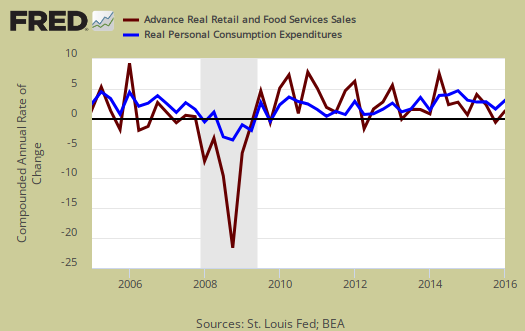
While in no way do retail sales equal consumer spending in the United States, there is a strong correlation of trend. Below is a graph of real PCE against real retail sales, quarterly, up to Q1 2016. See how closely the two track each other? PCE almost looks like a low pass filter, an averaging, removal of "spikes", of real retail sales.
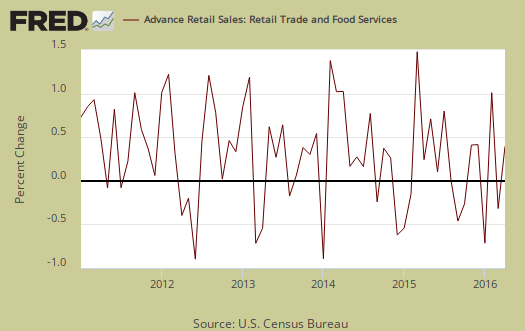
April retail sales are not adjusted for price increases, not reported in real dollars. Real economic growth adjusts for inflation. Retail sales has variance, margins of error, and is often revised as more raw data comes into the U.S. Department of Commerce (Census division). For example, this report has an error margin of ±0.5%. Data is reported via surveys, and is net revenues of retail stores, outlets. Online retail net revenues are asked in a separate survey of large retail companies (big box marts). This is also the advanced report. To keep the monthly nominal percentage changes in perspective, below is the graph of monthly percentage changes of retail sales since 2011.
For the three month moving average, from February to April in comparison to the January-November average, retail sales have increased by 0.3%, which was dragged down by January and February. The retail sales three month moving average in comparison to a year ago is 2.8%. Overall as shown the below graph of quarterly annualized retail sales percentage change, up to Q1 2016.

Overall retail sales point to a much better second quarter economic start. That said, advance reports almost always are revised the next month as more raw sales data is collected by the Census and many other elements to the economy go into GDP, retail sales is not the end all, be all metric.
Here are past retail sales overviews, not revised.
Recent comments