
The March 2011 U.S. trade deficit increased $2.8 billion to $48.2 billion. The February 2011 monthly trade deficit was $45.4 billion. $31.3 billion of the March trade deficit is oil related, $8.8 billion more than 1 month ago, and 51.2% of the total goods trade deficit. Services have surplus of $13.9 billion and increased $0.2 billion last month.
In comparison to a year ago, the trade deficit increased $8.7 billion with exports increasing 14.9% and imports increased 16.4%.
Imports were 1.28 times larger than exports for February. In other words, for every dollar we export, we import $1.28 worth of stuff. This is on a Balance of Payments basis.
The United States basically has two major problems with the trade deficit, Chinese goods and Oil imports.
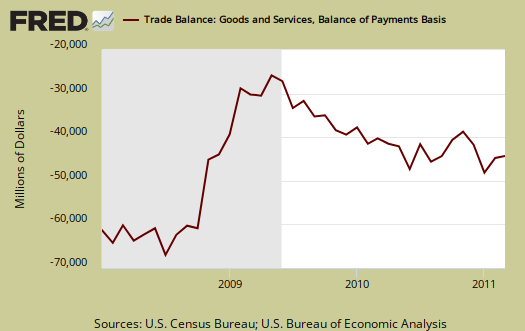
Below are imports vs. exports of goods and services from January 2007 to March 2011. Notice how much larger imports are than exports, but also notice the growth, or rate of change between months of U.S. exports.

Below is the list of good export increases from February to March, seasonally adjusted. Industrial supplies includes oil and petroleum related products. This was the highest jump since 1994.
- Automotive vehicles, parts, and engines: +$1.6 billion
- Industrial supplies and materials: +$2.5 billion
- Other goods: +$0.76 billion
- Foods, feeds, and beverages: +$0.63 billion
- Capital goods: -$0.30 billion
- Consumer goods: +$0.74 billion
Exhibit 7 gives Census accounting method breakdown for exports.
Here are the goods import monthly changes, seasonally adjusted, with pharmaceutical imports increasing +$1.9 billion in a month.
- Industrial supplies and materials: +$7.74 billion
- Capital goods: +$1.6 billion
- Foods, feeds, and beverages: +$0.03 billion
- Automotive vehicles, parts, and engines: +$2.14 billion
- Consumer goods: -$1.98 billion
- Other goods: +$0.58 billion
Running a trade deficit in advanced technology is not a good sign for those jobs of tomorrow and this deficit is increasing:
Advanced technology products exports were $25.3 billion in March and imports were $32.2 billion, resulting in a deficit of $6.9 billion. March exports were $4.3 billion more than the $21.0 billion in February, while March imports were $5.3 billion more than the $26.9 billion in February.
Here is the breakdown with major trading partners, not seasonally adjusted. China is the worst trade deficit, with $18.1 billion, yet last month was $18.8 billion, and from January to February we had a $4.5 billion decrease in the China trade deficit. Expect this to reverse itself as China had record exports this month.
OPEC, which is oil, increased, to no surprise. March is the start of the Japan disaster, yet there must be more time lag in the trade numbers, for that deficit also increased.
The March figures show surpluses, in billions of dollars, with Hong Kong $2.7 ($2.5 for February), Australia $1.1 ($1.4), Singapore $0.9 ($0.8), and Egypt $0.4 ($0.5).
Deficits were recorded, in billions of dollars, with China $18.1 ($18.8), OPEC $10.8 ($9.4), European Union $9.0 ($6.9), Mexico $6.2 ($5.3), Japan $6.1 ($5.2), Germany $4.6 ($3.3), Venezuela $3.0 ($2.1), Canada $2.8 ($3.0), Ireland $2.6 ($2.6), Nigeria $2.5 ($2.5), Korea $0.6 ($0.8), and Taiwan $0.6 ($0.9).
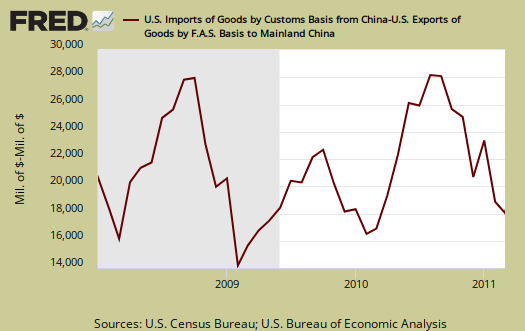
Below is the raw customs basis accounting of the trade deficit with China, not seasonally adjusted. China alone is 33% of the goods trade deficit for March.
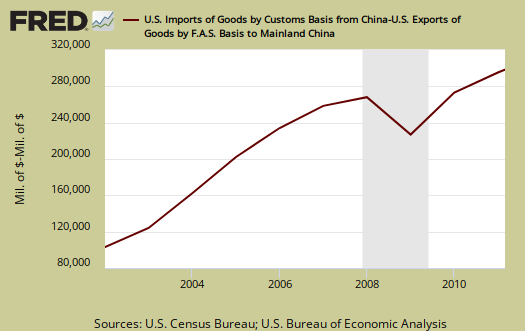
Below is a graph of trade deficit with China, per year. 2010 was a record for a trade deficit with China.
In terms of GDP revisions, this is reasonably in line with what BEA used as an estimate for March.
Here is February's report (unrevised, although graphs are updated). Here is the BEA website for additional U.S. trade data.
You might ask what are these Census Basis versus Balance of Payment mentioned all over the place? The above mentions various accounting methods so we're comparing Apples to Apples and not mixing the fruit. The trade report in particular is difficult due to the mixing of these two accounting methods and additionally some data is seasonally adjusted and others are not. One cannot compare values from different accounting methods and have that comparison be valid.
In a nutshell, the Balance of Payments accounting method is where they make a bunch of adjustments to not count imports and exports twice, the military moving stuff around or miss some additions such as freight charges. The Census basis is more plain raw data the U.S. customs people hand over which is just the stuff crosses the border. The 2005 chain weighted stuff means it was overall modified for a price increase/decrease adjustment in order to remove inflation and deflation time variance stuff.
Bottom line, you want just the raw data of what's coming into the country and going out, it's the Census basis and additionally the details are only reported in that accounting format.
Recent comments