
The U.S. October 2012 monthly trade deficit increased by 4.9%, $1.963 billion to $42.24 billion. The trade deficit with China hit an all time monthly record of -$29.466 billion. The year to date trade deficit with China is -$261.647 billion, which means the United States-China trade deficit will exceed the record 2011 annual trade deficit with China and be greater than 2011's 3.7% of GDP.
October's U.S. exports declines -$6.815 billion or -3.8%. Imports decreased by -$4.852 billion, or -2.2%. The three month moving average gives a trade deficit of -$41.7 billion and a change of -$203 million, or 0.5% increase in the trade deficit over a span of three months.
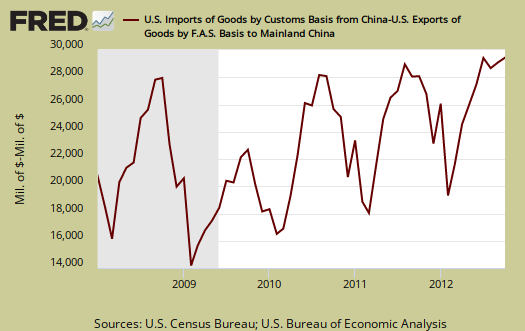
The U.S.-China goods trade deficit alone was, -$29.466 billion, or 45.6% of the total goods trade deficit and this ratio includes oil, our largest commodity import. The year to date tally of the goods trade deficit with China is -$261.647 billion, or 42.4% of the entire goods trade deficit to date. In October 2011, the China goods trade deficit up to that time was -$245.501 billion. This is a year to date increase of 6.6% in the goods trade deficit with China in comparison to 2011. The United States will have an over $300 billion trade deficit with China for 2012 as the 2009 November and December trade deficit with China was -$45.9 billion. Global trade collapsed in 2009. China's never ending import barrage is highly cyclical as one can see in the below graph of the not seasonally adjusted trade deficit with China and why we compare to this time last year in order to try to remove seasonality.
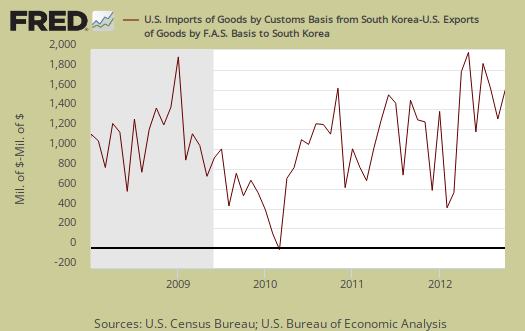
The South Korea-U.S. trade deficit is quickly rising. From January to October 2012 we have a $13.637 billion trade deficit with Korea. The same time period for 2011 shows a $11.404 billion Korean trade deficit, a 19.6% increase. March 15, 2012, the South Korean NAFTA style trade deal went into effect. Bear in mind the claim this trade agreement would help the U.S. economy. Trade deficits do not help the economy. Below is a graph of the Korean goods trade deficit, not seasonally adjusted and also cyclical, in particularly the cyclical high point seems to be December.
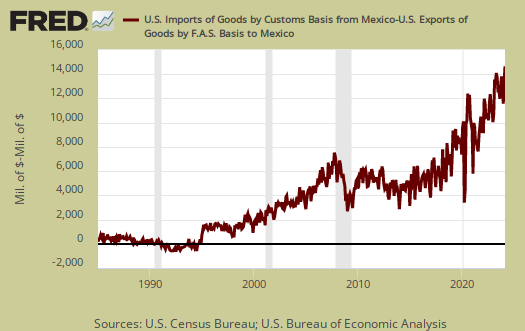
For comparison's sake, NAFTA went into effect January 1, 1994. Below is our goods trade deficit with Mexico, not seasonally adjusted. The 2012 January to October trade deficit with Mexico was $52.553 billion and it is 2.1 times larger than the trade deficit with Canada. Canada is the other country in NAFTA, yet have wage and environmental protections.
Oil or petroleum showed an end use trade deficit of $24.612 billion, for October, a increase of $3.039 billion, or 14.1%, from last month. Petroleum related end use was 42.2% of the October goods trade deficit. When adjusted for prices, Petroleum related end use increased by 7.4%,which shows how much the price of oil affects the trade deficit. Petroleum related imports from China as essentially non-existent.
End use means the final use of the product and includes oil byproducts. For example, plastics are made up of petroleum, yet by their end use category, would be marked often as consumer goods.
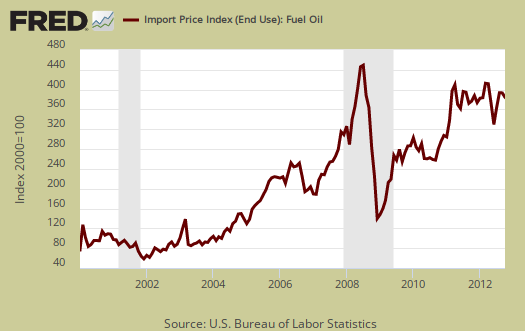
The United States basically has two major ongoing problems with the trade deficit, Chinese goods and Oil imports. Below is the not seasonally adjusted import price index for oil fuel. The average price for a barrel of oil in October was $99.75.
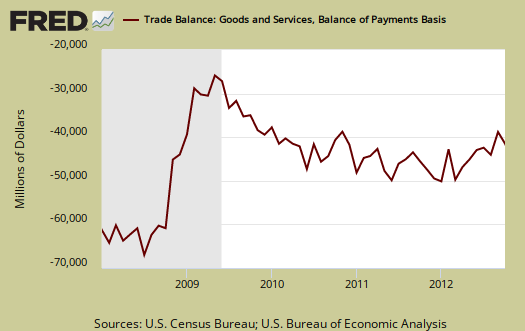
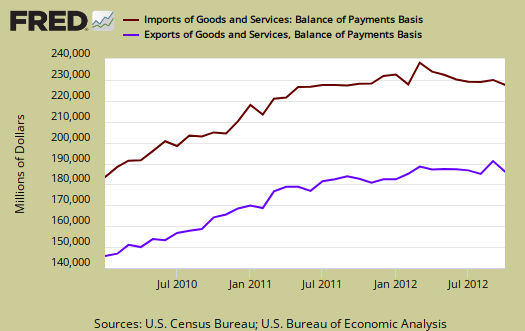
Below are imports vs. exports of goods and services. Notice how much larger imports (maroon) are than exports (purple), but also notice the growth, or rate of change between months of U.S. exports over time. To state the obvious, imports subtract from GDP and exports add. While pundits pontificate over exports, it's the deficit that really matters when it comes to economic growth or lack thereof.
Below is another view of imports (maroon, scale on the left) against exports (blue, scale on the right). Notice the time line. Before NAFTA, 1994 we were breaking even and not running a deficit in trade. The China PNTR came into effect at the end of year 2000 and since then we are getting more trade deals passed with the claim they create jobs. Clearly that is false, as our ballooning trade deficit shows. We are exporting jobs is more the case. Politicians who claim these bad trade deals increase jobs or even increase exports are praying you never read a chart or number in your life. Else, you would see the truth, our trade deficit simply keeps growing. Only a global recession, as happened in 2008, can cause the massive trade deficit to shrink.

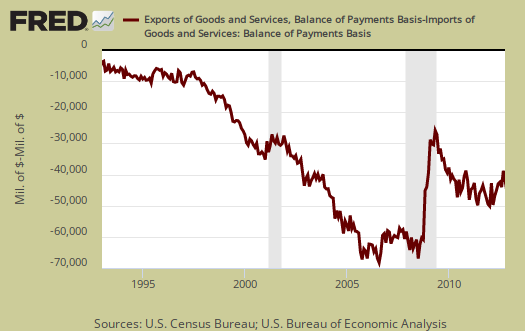
Below is another view of our trade deficit, as it grows with every bad treaty signed. The gray bars in the graph indicate recessions.
Below is the list of good export monthly changes, seasonally adjusted, by end use. The breakdown below is by the Census accounting basis, not the reported balance of payments amount and from exhibit 7. Goods exports, on a Census accounting basis, decreased -$6.407 billion in October. Soybean exports reversed themselves again from last month with a -$1.134 billion decrease in exports. Civilian aircraft exports also dropped -$1.021 billion. Industrial materials increase was due to petroleum products, other, exports, which decreased -$962 million. These would be by-products of refineries, not in other classifications, such as wax and Petroleum coke. Nonmonetary gold exports also decreased -$864 million. .
- Automotive vehicles, parts, and engines: -$0.370 billion
- Industrial supplies and materials: -$2.855 billion
- Foods, feeds, and beverages: -$1.432 billion
- Capital goods: -$0.390 billion
- Consumer goods: -$0.073 billion
- Other goods: +$0.190 billion
Below are the goods import monthly changes, seasonally adjusted. Overall imports decreased -$4.768 billion from last month on a Census accounting basis and most of it in consumer goods. The story here is crude oil. Imports increased by $2.090 billion from last month and thus made the overall trade deficit in October worse, second to China of course.
Auto parts imports have declined for three months in a row. The Obama administration filed a WTO complaint, yet there are no actual tariffs being imposed against Chinese auto parts at the moment to explain the decline beyond the political. Offshore outsourcing of auto parts manufacturing to China has resulted in a 700% auto part import increase over the last 10 years. Cell phone imports reversed themselves from last month with a -$1.322 billion decline.
- Industrial supplies and materials: +$0.396 billion
- Capital goods: +$0.586 billion
- Foods, feeds, and beverages: -$0.421 billion
- Automotive vehicles, parts, and engines: -$0.456 billion
- Consumer goods: -$3.639 billion
- Other goods: -$0.259 billion
Running a trade deficit in advanced technology is not a good sign for those jobs of tomorrow. The political spin is only low paying jobs are offshore outsourced. This is simply false and large sections of advanced R&D have been outsourced, along with foreign worker importation, which enables technology transfer and U.S. worker substitution. The below report statistics are not seasonally adjusted.
Advanced technology products exports were $26.1 billion in October and imports were $36.1 billion, resulting in a deficit of $10.1 billion. October exports were $0.3 billion more than the $25.8 billion in September, while October imports were $3.2 billion more than the $32.9 billion in September.
Here is the breakdown with major trading partners, not seasonally adjusted with the parenthesis being last month's deficit figures. China is the worst trade deficit, as detailed above.
OPEC can be assumed to be oil and the OPEC nations are: Algeria, Angola, Ecuador, Iran, Iraq, Kuwait, Libya, Nigeria, Qatar, Saudi Arabia, United Arab Emirates, Venezuela. The trade deficit with Nigeria is not scams, it's oil, although considering how many financial scams originate from Nigeria, one might think so.
The October figures show surpluses, in billions of dollars, with Hong Kong $1.9 ($2.2 for September), Australia $1.8 ($1.9), Singapore $0.5 ($0.7), and Egypt $0.2 ($0.3).
Deficits were recorded, in billions of dollars, with China $29.5 ($29.1), European Union $10.6 ($8.6), OPEC $8.6 ($7.1), Japan $7.0 ($4.8), Germany $5.4 ($5.2), Mexico $4.4 ($4.8), Canada $1.9 ($1.9), Ireland $1.8 ($1.6), Nigeria $1.8 ($1.2), Venezuela $1.8 ($1.1), Korea $1.6 ($1.3), and Taiwan $1.4 ($1.3).
Here is the BEA website for additional U.S. trade data, such as it is. May we suggest the Census make publicly available much more data so one can compare Apples to Apples, end use, NAICS and seasonally adjusted series. In fact, please complain to your Congressional representatives, for the Census demands $300 dollars per year to access any detail in trade statistics. That's not cool, we already pay for detailed trade statistics with tax dollars.
You might ask what are these Census Basis versus Balance of Payment mentioned all over the place? The above mentions various accounting methods so we're comparing Apples to Apples and not mixing the fruit. The trade report in particular is difficult due to the mixing of these two accounting methods and additionally some data is seasonally adjusted and others are not. One cannot compare values from different accounting methods and have that comparison be valid.
In a nutshell, the Balance of Payments accounting method is where they make a bunch of adjustments to not count imports and exports twice, the military moving stuff around or miss some additions such as freight charges. The Census basis is more plain raw data the U.S. customs people hand over which is just the stuff crosses the border. The 2005 chain weighted stuff means it was overall modified for a price increase/decrease adjustment in order to remove inflation and deflation time variance stuff.
Bottom line, you want just the raw data of what's coming into the country and going out, it's the Census basis and additionally the details are only reported in that accounting format. Additionally the per country data is not seasonally adjusted so watch out trying to add those numbers into the overall trade deficit. It's a statistical no-no to mix seasonal and non-seasonally adjusted numbers.
Here is last month's trade deficit overview, data unrevised.
Recent comments