
The U.S. July 2013 monthly trade deficit increased 13.3% to $39.147 billion and as expected. Overall exports decreased -0.6% while imports increased by 1.6%. The real news is the monthly China trade deficit just hit a new all time high of $30.1 billion.

The monthly not seasonally adjusted trade deficit with China was $30.083 billion. The China trade deficit alone was 42.7% of the not seasonally total goods deficit, on a Census accounting basis. The U.S. jhit a new record annual 2012 $315 billion trade deficit. The 2013 the trade deficit with China to date is $177.789 billion with five more months to go. The below graph shows how highly cyclical the monthly trade deficit with China is. Country trade statistics are not seasonally adjusted, yet this time last year the 2012 cumulative China trade deficit was $174.409 billion. In other words it is looking like America will see yet another record trade deficit with China for 2013.
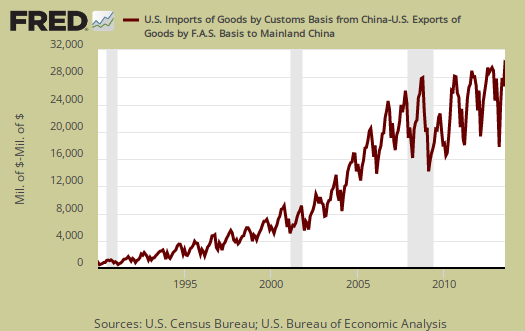
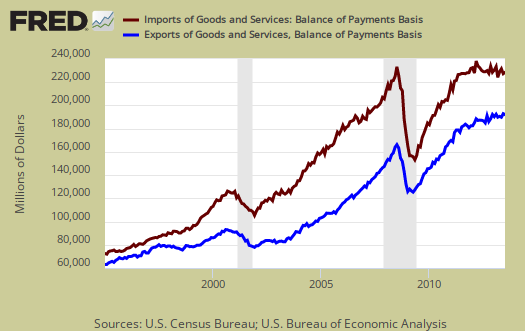
Graphed below are imports and exports graphed and by volume and beyond recessions, nothing seems to make a dent in the growing trade deficit. Imports are in maroon and exports are shown in blue, both scaled to the left. We can also see what bad trade treaties has wrought by the below graph.
Below are the goods import monthly changes, seasonally adjusted. On a Census basis, overall imports increased by $3.619 billion to $189.222 billion as crude oil imports came roaring back by $1.357 billion. Fuel oil imports also increased by $883 million and bad news for U.S. workers, auto parts imports really jumped up.
- Industrial supplies and materials: +$1.987 billion
- Capital goods: -$0.276 billion
- Foods, feeds, and beverages: +$0.125 billion
- Automotive vehicles, parts, and engines: +$0.807 billion
- Consumer goods: +$0.710 billion
- Other goods: +$0.266 billion
Below is the list of good export monthly changes, seasonally adjusted, by end use and on a Census accounting basis, declined by -$1,4 billion to $131.762 billion. The U.S. seems to be exporting petroleum products routinely these days and this month gave an additional $695 million worth. Nonmonetary gold exports increased by $412 million. What crashed and burned for July were aircraft engines, industrial engines and machines. Gems and Jewelry exports declined, together -$944 million in a month, a lot less blink for July. /p>
- Automotive vehicles, parts, and engines: -$0.179 billion
- Industrial supplies and materials: +$1.689 billion
- Foods, feeds, and beverages: +$0.343 billion
- Capital goods: -$1.606 billion
- Consumer goods: -$1.363 billion
- Other goods: -$0.343 billion
Oil or petroleum related end use was 39.5% of the goods trade deficit. End use means the final use of the product and includes oil byproducts. For example, plastics are made up of petroleum, yet by their end use category, would be marked often as consumer goods. While some in the press are claiming prices surged on crude oil, the report shows barrels imported increased by 12.8%, just about as much as our trade deficit widened.
Here are other trade deficit overviews, data unrevised.
Recent comments