
The DOL reported Initial weekly unemployment claims for the week ending on October 6th, 2012 were 339,000, a 30,000 drop from the previous week of 369,000. From pundits to politicians, people are freaking out for this makes initial claims the lowest level since February 16th, 2008.
Ok, we have repeatedly warned, ad nauseum, do not bank on initial claims, especially on the number reported in the press release for that week. Initial claims for unemployment benefits is a weekly statistic and that implies a very short time window for data collection, it is always revised the next week, almost always upward. One can have unusual events which throw off the seasonal adjustment algorithm. One can have missed timing of events that can also throw a monkey wrench in one week's worth of data.
Ok, now everybody notice that October 6th is the 1st week in the third quarter. That means states must do some bookkeeping per the federal law requirements that were part of the various emergency and extended additional unemployment benefits passed by Congress starting in 2008 with the stimulus bill.
States do this normally at the end of the quarter. What happens is States go through the officially unemployed wage records at the end of quarter for those receiving extended or emergency unemployment benefits. It's kind of an audit, required by these various extended and emergency unemployment benefit programs passed by Congress, starting in 2008. If a person receiving benefits from these programs made enough wages during that quarter, they must be reclassified for eligibility under the regular unemployment claims and unfortunately for the eligibility benefit amount to be received, that those new hours worked will determine the new benefit level. That means, even though that person has been receiving extended or emergency benefits, they must refile a new initial unemployment claim and be put into the regular program for the benefit those new wages determined.
Now this number of initial claims filed quarterly is due to federal law and resulting state audit quarterly bookkeeping and normally results in an increase of initial claims. Guess what happened? An unidentified very large state (ahem, cough, California or even New York), reported a decrease instead of the expected increase and didn't get their numbers in on time to boot. States which reported an increase in initial claims number 47.
Take that 47 number to the bank for increases and throw that large state to the wolves for screwing up this week's report, although we won't be able to verify the rogue nation until next week, when the individual state statistics are revealed.
Additionally, there is a surge in initial unemployment claims at the start of every quarter. We can actually see this by looking at the not seasonally adjusted initial claims. The quarterly surge is not just due to the bookkeeping requirements mentioned above, but also due to the benefits computation game for those applying for UI. If one waits to apply for unemployment benefits on a new quarter, that means the benefit amount will be higher than if one applies at the end of a quarter. Unemployment benefit is based on wages earned of the last quarter worked before applying for benefits. Usually people earn the most money right before losing their jobs (nice huh). That means if one waits until the start of the new quarter to file for unemployment, odds are they will get slighly more in unemployment benefits by waiting. The end game result of this fact is we see a surge in new claims at the start of each quarter. In other words, if a person waits to file until Q3, that means their benefits will be based on wages earned in Q2, not Q1.
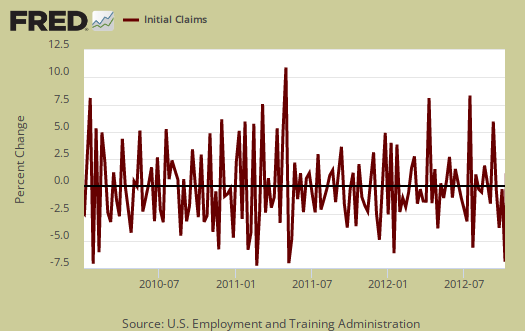
States missing reporting deadlines, sending incomplete data, general statistical data lag and statistics getting caught on the weekly reporting boundary are more common than the press would lead you to believe. Below is the weekly percentage change of initial claims for the last two years using the seasonally adjusted data. Here you can see the weekly reports are really volatile and not something to bank on. We also see this week's percentage change isn't that unusual.
Last week's initial claims were revised upward by 2,000 after the initially reported 367,000.
Below is the mathematical log of initial weekly unemployment claims. A log helps remove some statistical noise, it's kind of an averaging and gives a better sense of a pattern. As we can see, we have a step rise during the height of the recession, but then a leveling, then a very slow decline, or fat tail. That fat tail is our never ending labor market, stuck in the mud, malignant malaise.
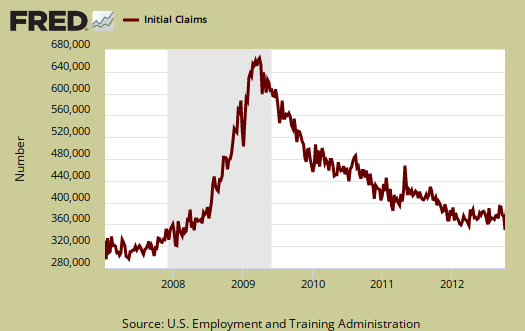
Below is the four week moving average, set to a log scale, from April 1st, 2007. The four week moving average dropped 11,500 to 364,000. Now due to this week's weirdness, that's probably too low, yet we can say for sure at least initial claims didn't ramp up. In the below graph we can see we still are not at pre-recession initial weekly unemployment claims levels. If anyone recalls, even before the Great Recession the job market was not so hot.

Continuing unemployment claims didn't budge, and we have large long term unemployed. The below figure doesn't include those receiving extended and emergency unemployment benefits.
The advance seasonally adjusted insured unemployment rate was 2.6 percent for the week ending September 29, unchanged from the prior week's unrevised rate. The advance number for seasonally adjusted insured unemployment during the week ending September 29 was 3,273,000, a decrease of 15,000 from the preceding week's revised level of 3,288,000. The 4-week moving average was 3,279,250, a decrease of 7,750 from the preceding week's revised average of 3,287,000.
In the week ending September 22, not seasonally adjusted, the official number of people obtaining some sort of unemployment insurance benefit was 5,044,649. More people moved into emergency and extended benefits but these figures aren't seasonally adjusted, so it is difficult to compare. Officially, there are 12.1 million unemployed.
.
The revisions are almost always up (as noted) - odds of that?
I could understand the lack of clarity on the weekly reports, that's fine. But the revisions are almost always up, and as people especially on zerohedge note, the initial claims are what the HFT machines read and act on, not the revisions a week later. The week after, any revisions are a week too late for full media megaphone coverage, and they are almost always up (i.e., worse news, but 7 days too late to make a difference in the media spin and HFT). Kind of like the media covering someone, blaming her for every crime known to man, and then when someone else is arrested and convicted, the media forgets to apologize to the 1st person. It's the initial news and reports everyone focuses on. I would expect a 50/50 revision up/down, even a 55/45 revision one way might be acceptable, but anything beyond that, highly dubious. If one can bet money on the fact that the revisions are going to be revised up from the previous week, and win 6 to 9 times out of 10, it's not looking good.
more evidence HFT algos are stupid
It's not the DOL's fault traders blow billions on this weekly report. If they are so ignorant and stupid of labor economics and macro economics to base an algorithm on this report, it's just more evidence that HFT is a big fat casino, divorced from the real economy and reality.
I've got issue with initial claims but way more issues with people paying attention to initial claims, as if it means something it really doesn't.
Wait a minute and I'll give you a number I think this week will be revised up by. I bet I can do a good guestimate.
Seriously though, every time I dig around in initial claims, the more disgusted I become by traders, Wall Street, HFT for putting so much emphasis on the report that should not be traded on. Not the initial number, or the weekly number, no way.
And yet the people using HFTs still have jobs - that's the joke
Agreed, HFTs are ridiculous. Plenty in hedge funds and pension administration are also ridiculous. The media, the government, well, why repeat myself. Watch the coverage of the Eurozone "crisis", etc. The "public servants" dressed in designer fashions and flying private jets, along with the media, are also laughable. The thing is the people propagating the lies and topsy-turvy world have jobs in which they'll never want for anything. The rest of us sit in squalor. The thing is there are people out there making $100,000 - $50,000,000/yr. to repeat lies, disavow the obvious, or spin their wheels day-in, day-out, while people with more integrity and brains are begging for jobs stocking shelves or trying to feed themselves. Everyone with a brain knows HFT are ridiculous. And the SEC and everyone else turns a blind eye to that and theft, insider trading, pension fund shenanigans, etc. Everyone with a brain knows the Euro is kaput, how many limousines and Michelin five star dinners and 6,000 cops guarding Merkel does it take to figure out Germany can't fully support the entire Eurozone by itself. Even if it could, should it be expected to? Germany's debt is 80%+ of its GDP, how's that for a booming economy before Germany's recession is officially announced within a few months? But these truths are repeated time and time again by hundreds of thousands of us, but hey, we scratch for food and housing because the insiders know damn well we won't toe the line, and thus, are "overqualified." We're turds in the punch bowl, as the saying goes.
I thought about the unemployment crisis in the US and why the unemployed are treated like lepers. And then it was obvious - it's just like "The Matrix." Once you don't have a job and remain outside "the system" for too long, you start to see how screwed up everything is. They aren't worried that the unemployed are lazy or stupid. Come on, they were the ones doing the firing, of course they knew they were firing people with great experience, the ones that had the most time in, etc. No, they knew once the unemployed were out there, looking, reading, figuring out why they got canned and visas were being filled, the "skills gap" lie was repeated daily 50 times on TV, etc., they could never go back to accepting the lies. And the longer the person was out there without a boss breathing down their neck, the more time they had to see what was going on. And with that knowledge, how troublesome would a great worker with years of experience be? DEVASTATING, and they deserve to be.
corporate "culture"
The most absurd HR ploy yet is to claim anyone unemployed need not apply but I think that has more to do with this "survivor game" mentality of work, falsely believing those who have jobs were deemed "too critical to the business", but that's a false assumption. Corporations fire critical personnel everyday with nary a thought on how that will affect later products and services.
Others only want "young" people, clear age discrimination and beyond they believe "young" are cheaper, they also believe "young" are more naive and thus won't realize the harsh work environment and bad treatment they are in, more pliable.
Back to initial claims, I do believe it's possible we saw a large drop, not 30k but a significant decrease for it does seem that businesses have stopped firing people, starting in September. So, I wouldn't claim the entire drop is a technical glitch due to at least one "large state" not getting their emergency and extended benefit "bookkeeping" in on time.
revision guestimate
Ok, I went and looked at particular at California on the 1st week of new quarters and it looks like, generally, they are late in their reports by two weeks. So, I'm going to guess that initial claims will be revised up by 10k and if that doesn't happen, in two more weeks we'll see a "pop up" in initial claims..
all of this shows again how volatile the weekly really is and the only number to really watch is the pattern of the four week moving average.
Also, in the September CPS, we noticed that layoffs and firings looked much much less, so it could also, at the same time as this "funky 1st quarter, later reportings" issue, initial claims really is dropping.
initial claims numbers for October 18th
Today's increase of initial claims by 46,000 to 388,000 validates what we said last week in this post. Last week was a fluke, probably due to California not doing their homework even though CA denies it, as well as people waiting until the start of a new quarter.
While they did not go backwards and readjust the figures, the two week average shows basically a 16,000 increase.
There is so much noise in the weekly statistics but I'm going to go out on a limb and say California probably underreported their initial claims last week in the 30k range, after seasonal adjustments are done.
We can't get to seasonally adjusted initial claims data per state, period, so needless to say this is a real thumb in the air and if you think the national initial claims are statistically noisy, the states are ridiculous.
The four week moving average is now 365,500 and that's an increase of 750 from last week and is about right and we are definitely seeing less firings, it's showing up in all sorts of labor statistics.
Bottom line is never go off of the week's numbers and always use the four-week moving average. If that has a lot of statistical noise but the past two weeks have just further validated what we said, people are nuts to react to the weekly initial claims figures.
Four-week average of new jobless contradict BLS October unemp.?
Mr. Oak, you were right that the prior week's huge drop in new jobless claims was bogus, intentionally or not. Many people pointed to it as evidence the BLS October unemployment rate drop to 7.8% was "real". But now that that big drop in new claims last week has been proven false, that brings the October BLS numbers again into question.
You said the weekly new jobless claims numbers have always been volatile, and better is the four average. So does the four-week average of new jobless claims for October support or contradict the BLS numbers of nearly 1 million new jobs created in that one month?
Bob Clark
About the comparison of the BLS unemp. and new jobless numbers.
In addition to comparing the 4-week average of new jobless claims to the BLS new jobs number for October, could you focus on that week of new jobless claims when the BLS does its household employment survey?
Bob Clark
Discrepancy between BLS household and employer surveys.
The discrepancy between the BLS household and employer surveys for September has been explained as due to the part-time jobs, since the employer survey does not count those.
But when you subtract off the 570,000 part-times from the 870,000 new jobs created, that still leaves 300,000 full-time jobs. That's nearly three times higher than the employer survey number of 114,000. Have there been cases before where these two ways of counting the full-times, which are more of a apples to apples comparison, have been so far off?
Also, correct me if I'm wrong but reading between the lines this article with an interview with a BLS economist seems to be saying even the BLS doubts the 7.8% number is actually correct:
October 5, 2012, 2:52 PM
Taming Volatile Raw Data for Jobs Reports
By CATHERINE RAMPELL
7:32 p.m. | Updated
http://economix.blogs.nytimes.com/2012/10/05/explaining-the-big-gain-in-...
In fact it appears to be the general consensus among the experts including yourself that the BLS numbers for September are probably not correct. That in itself is an important fact, regardless of whether it was intentional or not.
Getting back to that article, they seem to be suggesting that changing trends in the time when young people leave Summer jobs effects the accuracy of their seasonal adjustments. If that is true then they still applied the same seasonal adjustments when the evidence implies they are no longer valid. That is not to say they were being intentionally deceptive, but only they have not yet created the new models to account for the changing trends.
Also, I saw you discounted the effect of the young people numbers. But the article said they accounted for 42% of the increase. When you take into account a large part of the remainder would be the part-times, the discrepancy from the employer survey would be much less.
Bob Clark
Hello Robert Clark, read this
here and here.
Also, initial claims, against payrolls, I do a graph in this post, plotting the two to show the relationship.
Looks like I need to improve the site layout so additional posts on topics can be found more easily.
TBD!
If you like EP you might consider registering so you don't go into the moderation, keep out the spammers queue.
Comparing new jobless claims with new job hires.
Thanks for the response. I especially like this article of yours:
http://www.economicpopulist.org/content/initial-claims-unemployment-just...
That graph comparing the new jobless claims and the new hires by the payroll survey is quite telling. Is the connection between the new jobless claims and the household survey also generally close? If it usually is but for September it was badly off that would suggest something wrong with the September household survey numbers.
Also, this article focuses on Sept. 15th. Isn't the BLS household survey done around Sept. 19th? Do you have the new jobless claims for that week? Do they suggest there was some great drop in new jobless claims then corresponding to the startlingly household survey new job numbers?
Bob Clark
CPS is monthly
Above is Civilian employed vs. initial claims. Civilian employed is the level change from one year ago and initial claims is the 4-week moving average and zeroed around 400,000 levels. The scale for initial claims is on the left, in maroon, the scale for household survey employed levels is on the right, in blue.
The reason civilian employed levels are the change from one year ago is statistical noise. The survey is too small and the survey window is one week, that's correct, for monthly figures to not have too large of variance to see any correlation.
Again, this is why one wants to look at payrolls, or CES for monthly comparisons and why month to month comparisons on the civilian employed levels is a fool's errand.
Same as looking at 1 week of the initial claims number and going off of that. There just is too much variance, delays and resolution issues with the actual raw data to do that.
Anyway, the two do correlate as we can see.
New jobless claims correlates with household survey unemployment
Thanks. So there is a good correlation just as for the payroll survey.
The numbers I've seen for the weekly new jobless in September don't seem to be so radically smaller as would be suggested by close to a million new jobs in that month. What was the 4-week average of the new jobless in September?
Also, as you are aware the BLS actually conducts the household survey in one week and extrapolates the numbers out to a month. What were the new jobless claims in that one week?
Bob Clark
CPS survey week includes 12th of the month
So, you'd have to look it up, but honestly that's a huge mistake to try to get exact matches on a weekly basis. First off, people who lose jobs do not necessarily immediately apply for unemployment insurance, they might wait, even to the next quarter as noted. Second off, states process initial claims slowly, miss deadlines to turn in their numbers so the timing can be off. As we can see even the monthly household survey has a lot of statistical noise so people are trying to get real time data and unfortunately (blame Congress, funding idiotic, antiquated data collection methods) government data really isn't.
I haven't run a graph but I imagine trying to plot week per week against the CPS will look like pink noise (static, meaningless) esp. if one ran a true cross-correlation of the two series.
GDP will come out on Friday and trust me, whatever that number is, it won't be that number by the 2nd revision. Always happens, esp. trade data...it dribbles in, is revised, businesses reporting figures are late, or revised and so on.
This are really large aggregate numbers.
BTW: You're not logged in. ;)