
It's like someone pulled the unemployment rate out of a Star Trek transporter, as if America entered a time warp machine and we moved to another dimension through a worm hole. A 0.3 percentage point drop to 7.8% makes no sense when there were only 114,000 jobs added. Captain, can the unemployment rate be right and we really did defy the laws of statistics?
We want to point to something which might in part explain what happened this month with the household survey statistics. That is how long someone holds a job. We don't have monthly statistics on job tenure, yet it could very well be that finally, people are working longer at a job. The never ending Schindler's List attitude towards U.S. workers may have abated. The U.S. has disposable worker syndrome, where people are laid off and fired for no damn good reason at all. It's a fact of the American work life while one has a job one week, there is no guarantee one will have a job the next.
To wit, let's look at another obscure BLS statistic, labor force status flows. This is the number of people flowing from being in the labor force, out of the labor force, employed and unemployed on a monthly basis. Below is a graph of the monthly changes of people who moved into employment from already having a job, not being counted at all, or being part of the official unemployed since 2006.
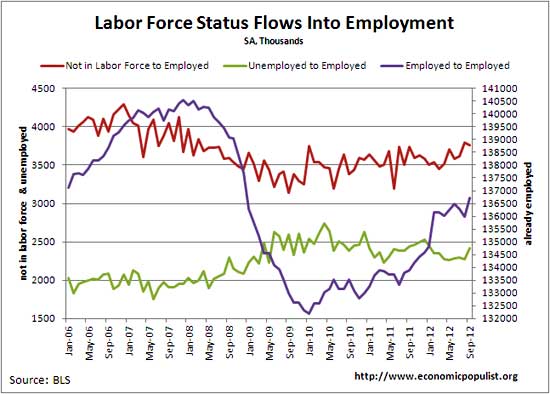
We can see from the above graph many more people who are currently employed are remaining so into the next month. We also see people who are unemployed are not getting jobs like they were before 2008 and those not in the labor force aren't getting as many jobs either.
A study with older statistics showed workers were not keeping their jobs for long, so the above trend maybe a more positive sign in terms of job duration.
Another statistic from the September employment report is a huge uptick in part-time employed for economic reasons, 582,000.
Some people are in part-time jobs because they want to be, others because they cannot find anything else. There are 8.613 million people stuck in part-time jobs because that's all they can get. Below is a graph showing how much non-voluntary part-time workers has increased.

Some are stuck in part-time because their hours were cut by their employer. These part-timers due to slack work now number 5,523,000, an increase of 306 thousand from last month. Below is a graph of forced part-time because they got their hours cut as a percentage of the total employed. This metric is a solid recession economic indicator. See how closely the percentage increase matches recessions, the gray bars? The percentage of people in part-time jobs due to slack economic conditions has stayed extremely high since the start of the Great Recession and runs in trend with other economic indicators, unlike this month's unemployment rate decline.

We've already examined some of the differences between the payrolls reported gain vs. the artificial drop in the unemployment rate and found the probable cause was statistical and seasonal adjustment errors.
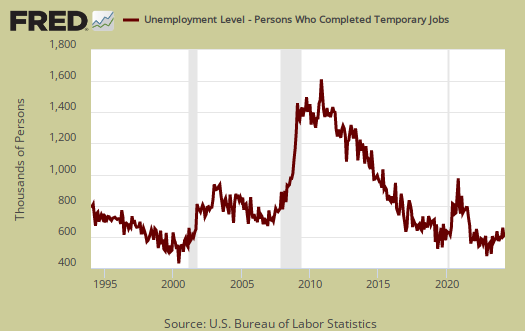
Persons who completed temporary jobs dropped by -218,000, the largest monthly drop in the history of the series. It is possible that more temporary jobs were extended and became permanent? One thing we can rule out on this monthly change is a seasonal adjustment error for there is no corresponding gain in another month.
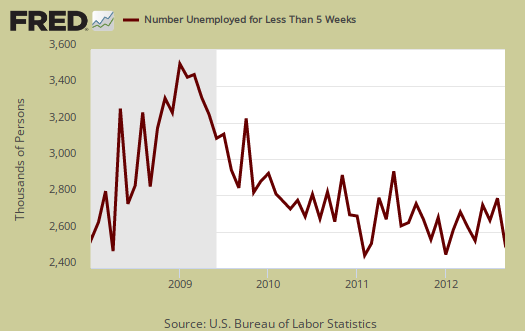
To amplify the possibility of more temporary jobs turning into permanent, even part time, we had a dramatic drop in those newly unemployed for less than 5 weeks in September. This is 302,000 less and a -10.6% change from August. The drop isn't a record by any means, yet does support the hypothesis there were less layoffs, fires and loss of temporary jobs than expected in September.
Another area which was amplified in the BLS Commissioner's statement are strange goings on with the 20-24 year olds' drop in unemployment levels and employment gains from the September household survey. Those employed increased 368,000, the highest monthly amount in the history of the series, yet unemployment in this age group dropped -206,000.
Here there is clearly something wrong with seasonal adjustments for the previous month shows those 20-24 year olds employed declined by -250,000 while those unemployed increased by 32,000.
Yet can one blame this month's absurd, unrealistic employed gains and unemployment rate drop on just the 20-24 year olds and seasonal adjustment error?
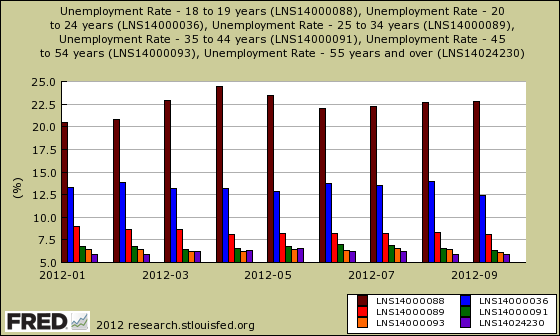
We think not and the below graph is the reason why. Below is the seasonally adjusted level change in employed from the household survey, broken down by age brackets. The graph bars are in order by youngest to oldest. The bar colors are: ages 16-19, maroon; ages 20-24 blue; ages 25-34 red; ages 35-44 green; ages 45-54 orange and those over 55 purple.
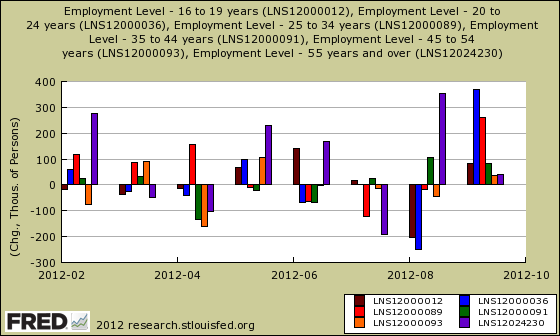
As we can see, each month, different age groups show dramatic changes in reported employed. We could just as easily blame the 25-34 age bracket. Their September 2012 employment levels increased by 260,000. Or blame the gray hairs. Those 55 years of age and over added 352,000 employed in August. Historically, there are wide swings in number of employed for all age groups in September and for each year, which age group had that large change in those employed also varies. Graphed below, using the same color scheme, are unemployment rates per age bracket, seasonally adjusted. Here too we see significant variance on a month to month basis.
While the 20-24 years old job level increase is a record high, if one takes August and September together, we get a net gain of 118,00 for this age group over two months. Bottom line, the 20-24 year olds employed level increase still doesn't explain September's overall huge increase of 873,000 newly employed. Even if one subtracts off 368,000 employed blamed on those pesky 20-24 year olds from the monthly household employed change level of 873,000, we still have a monthly unrealistic increase of 505,000 while payrolls only increased 114,000. Realistically, we would have some level change, not zero, for 20-24 year olds each month.
As previously discussed in this post, September's unemployment statistics are better explained by the shortcomings generally with the survey than by cherry picking one series of unfortunate statistical events and claiming that is the cause. Every month we look at the employment report and every month there is at least out of kilter metric which seems way out of whack for a monthly change. Overviewing the monthly employment statistics always involves discrepancy dissection discourse. The real numbers to bet the farm on each month are from the establishment survey, nonfarm payrolls.
The survey itself is manipulated
I feel that the survey itself was manipulated.
you "feel"? Did you read anything in this post?
That's the problem, one doesn't "feel" statistics, one learns and understands them.
Folks, drink some coffee, sit down, let your logic brain take over for just two minutes and try to comprehend just one number and one graph, anywhere, not just this site.
That's the entire point as well as the complaints about the survey, it's facts, evidence, logic, numbers...
One cannot "feel" and just say "I believe" therefore it must be so.
The only way we can find if
The only way we can find if the Survey was manipulated, is to go through all the survey calls, find out how the "random" people were identified, were the responses recorded correctly.
Looking at the numbers and stats from fake surveys will show the anomalies, which you have correctly identified, but will not prove that we are looking at fake data.
actual surveys
I think you're a little CT here. Read "under the hood" but there is also a time window on the survey which is only worked "one week out of the month" in so many words. There is a reference week, which always contains the 12th of the month which is counted.
This is just one reason why on a month to month basis, CPS comparisons have a lot of statistical noise in them.
I wrote a little opinion on the survey itself and think the Census should pay people for their responses but "audited" for accuracy. That would give people more incentive to be honest, while the BLS throws out outliers and accounts for this statistical speaking, I think the sample size is also just too damn small.
But in terms of some Dem operative getting to the survey respondents, very CT.
Excellent, thorough - howls from govt. are overwrought
Nice thorough breakdown. People should be disturbed (outside the blog reading public) with massive problems in sampling and other issues. It's pretty funny the way the Secy. of Labor and everyone else in the govt. was all of a sudden offended and so disturbed by the claim that the govt. could actually manipulate numbers. So emotional, so offended. Really? People question stats and reliability and they get emotional? Odd. Almost like they expected questions and people to disbelieve them. Yeah, because the govt. must be believed 100% of the time. Without even getting into recent events, didn't a certain govt. conduct medical experiments on its own citizens without their consent over many years involving all sorts of people and diseases? Or create a second incident in the Gulf of Tonkin to justify military conflict? So forgive the US people for asking questions, I thought that was our duty. We're simply questioning labor and unemployment statistical differences of .3%, I think the howls and protests from govt. officials and political + media puppets seems a bit over-the-top and in the realm of "doth protest too much." Now, when it comes to the real unemployment rate, U-6, and the massive numbers of people not working, working part-time, and historic levels of food stamp usage, come on, this country is down the crapper (both D & R to blame so again, this ain't partisan and won't be fixed by charades practiced every early November). Besides which, experience out here in the field among those looking for work or in jobs says these people are all jacked up and excited over sh*t jobs. The jobs someone could look to to help America prosper, along with helping himself/herself are gone, gone, gone. Selling crap on eBay or passing out election pamphlets doesn't an American feed.
Solis "emotional", I don't blame her a bit on that
They accused the BLS of throwing the Presidential election, so despite the fact I think she's a lobbyist tool. Solis loves outsourcing, foreign guest workers and she's LABOR secretary??? R u kiddin' me???
Back to this, I think she had every right to be emotional with an accusation such as someone stuffing the statistics in order to obtain an employment rate that could win an election.
Honestly, I've been reading BLS statistics for some time now and frankly this happens every month, so that's one hell of a planning schedule to throw off one number by 0.3 percentage points!
That said, we clearly need better metrics and I want objective accurate ones, without "politics".
Case in point is the false assumption the Census cannot ask about immigration status for that will be "sensitive" to survey respondents. Hello, that's a key critical piece of information we need to know about labor markets and I doubt, in 2012, with 80k illegals showing up in a day to get work permits, being interviewed on every local and national news channel, is that question "too sensitive".
If you can have hundreds of thousands line up for work permits you can ask survey respondents if they are on a guest worker Visa, which type, or are they "undocumented".
So, in spite of Solis being perfectly within reason to be insulted that the BLS or Census (who performs the CPS) would throw a Presidential election,
she still is a political crony to me.
We need accurate, objective, direct data methods and points requests from statisticians, economists and frankly us, it's our damn data in reality, we pay for it, so we should have some input in obtaining better statistics, of course the public has to have a clue about them in the first place.
Why a Labor Participation Rate climb if U1 is False?
The labor participation rate climbed a tenth of one percent. If the U1 stats were phony, the Labor Participation rate would be stable or fall. The size of the domestic labor force has increased.
Look, we have said so much against the U1 rate, this administration weakness from a labor/populist/left perspective here. We are no shills for Obama. He has been weak and disappointed us.
After the so-called "Stimulus", Most here have focused economic blogs toward the expansion of the economy by all means. This site is no orthodox left perspective. We need Bob to chime in.
Burton Leed
yes, chiming, less layoffs, fires, loss of temp. jobs
the LPR ticked up due to the increase in the size of the labor force w.r.t. population. CLF increased 418 thousand while non-institutional civilian population increased 206 thousand, result an uptick of 0.1 percentage points to 63.6% for a labor participation rate.
Not in the labor force dropped 211 thousand, but I don't find this unusual since last month those not in the labor force grew by over half a million.
I've been ignoring this for now because I need to break it all down by age brackets and I'm pretty convinced this month's statistics went outside the margin of error.
Civilian labor force = employed + unemployed and that mega jump in employed is what is causing the drop in the unemployment rate, i.e. U-3 (it's not U-1, it's U-3 that is the official unemployment rate).
I've already chimed in and why I focused on other statistics this month. I strongly suspect the normal amount of temporary jobs were extended in addition to layoffs and firings returning to pre-recession levels.
For now, I think this is further justified because those unemployed 5 weeks or less declined by 302,000 in a month, which implies we had a sudden job "lengthening" or "extension" of jobs that would be expected.
Hidden, subtle, I know, but that's what the data is leading me to conclude.
U3 is "false" because there is no way in hell we got 873 thousand additional jobs in a month. That's how it's being interpreted anyway. It's actually "additional employed". What I'm pointing to is there were less who lost their job than would be expected and why that is, could be a statistical anomaly, or could be....drum roll, more jobs became permanent, yet also more part-time.
I edited this post to include the unemployed less than 5 weeks to show the implications. Initial unemployment claims was down to 365k levels the last two weeks of September so, this too supports the idea there were less layoffs, firings and loss of temporary jobs.
That's all good if not a statistical monthly outlier.
America has a real problem with facts generally
The Presidential debate had massive lies in it. I have one article in progress on taxes to show the lie.
We have media who covers "body language" and "facial cues" with sophisticated AI to analyze second by second expression.
If only they would devote themselves to the facts.....wouldn't that be nice.
Then we have the government, where spin is in. We even have some economists spinning their statistical weave of lies to ensnare us in their political agenda web. I've seen it many times with variables set to zero, absurd assumptions, buried way deep in the mathematics so no one (except one bored geek who doesn't surf for porn)....would find them.
We need a culture of objectivity, a culture which respects scientific methods, where manipulating raw data is a sin akin to being a child molester. We need a culture of respect for science, statistics, and objectivity is paramount.
With this FUBAR Congress and these politicians pulling the strings, think we'll get that?
Anyone realize corporations force government statisticians to sign NDAs and repress a host of data which might expose the fact they are offshore outsourcing our jobs?
Since when can a corporation force the government to sign NDAs to even get a hint of data?
We can spy on the people and lock 'em up indefinitely via the patriot act yet somehow corporations are exempt? I thought corporations were people and government should trump private businesses in obtaining data for accurate portrayal of the U.S. economy and especially labor markets.
I see it on this site. The entire purpose of EP is to amplify facts and by that amplification get people to realize they should be outraged. But spin, we do not. Who needs spin when with a little math and graphs one can see the U.S. middle class being sent to the globalization garbage heap on a daily basis?
Come on people, math is your friend, logic is your friend and facts are your friend.
Respect the number, read it, study it, love it!
Plenty of well-educated people, but they are ignored
The thing is there are plenty of people in the population that have excellent educations and read, read, and read some more. So when the media and businesses blame our education system or say Americans are idiots or our public education system everywhere in every state and district is terrible and privatization by Murdoch and charter schools is the answer, we know that's a lie. But we're out here, reading and learning until we die. And not just mainstream news (worthless unless its international sources), but everything under the Sun, blogs, classic literature, foreign affairs, stats, science, history, math, etc. Plenty of understanding of not only their own fields, but a real interest in learning as much as possible about everything else they have an interest in. But looking at who rises to the top in the media and business and politics today, it's damn obvious the people that know what they know and what they don't are purposely shut down and ignored. I don't need to hear Chris Matthews kiss Kennedy ass one more time (Chris, that was the 1960's, move on, find some new ass to kiss) or watch talking points repeated ad nauseum on all the channels and conveniently splitting everything into some arbitrary Democrats vs. Republicans theme on every issue. Out here we know those that ask questions and show an interest are purposely ignored. Your site and other sites have repeatedly shown that people with the skills and education are purposely not hired, purposely blamed for things they have no control over. Quite frankly, they want customers and drones. And if people learn "too much" or show a willingness to ask questions, they aren't drones, so corporate/govt. America doesn't want them. "Overqualified" is the new message to all those that know, learn, or simply want to ask questions. What's the reward for doing what we were told to do or simply being interested citizens? We're screwed over at every turn. Have plenty of knowledge and try to understand things? Great, join the long-term unemployed and sit there with all that knowledge festering as asshats with no morals and less knowledge bring in six-figure or seven-figure salaries. And then be judged by those very same asshats or be derided as "lazy". Sure, we'd like to work in the govt. or fix corporations or work on international issues of concern that affect us all, but we're not allowed past the velvet rope and our voices are drowned out by dolts with golden megaphones.
U.S. is highly educated, best universities in the world
That said, we need more people to pipe up, to confront the never ending spin machine.
I'd also say, since we started EP, it does seem numbers are getting their due, but still not enough.
I agree with you and every time I hear "retraining" and "community colleges" when most Americans already have the training and education for jobs and on top of things, the real effective job training is on the job, done by employers, I just want to throw a shoe at whatever screen that insult is originating from.
That bogus crap is actually a lobbyist "talking point" and has been going on since they started labor arbitraging Americans as the "blow off" response so people do not revolt over the fact they are labor arbitraging the U.S. citizen workforce as a whole.
Sure people without a high school diploma and so on need more education and training, but that's only part of the labor force and has nothing to do with PhDs, Masters, Bachelors, 20 years of experience U.S. citizens being thrown under the labor bus.
I rant your rant and up the ante. ;)
Best Universities Translate to Outsource U..S Jobs.
51 of the 100 best Universities in the world are U.S. So what, if the graduates of the world's best schools work in Starbucks. Who cares how much you improve education if education is the dodge of the Corporate elite who need to find an excuse to bring in Visa workers and send jobs to foreign subsidiaries.
So what about the rest who do not go to college? Germany and Switzerland have a 25 percent college grad rate and a workforce participation rate of 78 and 83 percent respectively(U.S 63.7).Yeah, Switzerland is a democracy, not a plutocracy. Germany and Switzerland have job training and placement for high school grads.
So why don't you get out? Trust me, I have applied. We've fought in every war back to Indendcence, but I can't respect a country who has no respect for us.
Burton Leed
love your charts
Great charting, Robert. I appreciate it. I especially like the forced part timers as % of employed. I'll be watching that closely from now on since it seems to be a recession indicator.
Re: the conspiracy theory. We all know that job data is noisy and that it takes several months to show a trend.
In the meantime, the civilian employment-population ratio has barely budged since the crash. I trust that metric far more than U-3.
Thank you
Check out the other post some differences between payrolls and household, if you're a graph-o-rama person such as I. There I charted out the adjusted CPS series and did a couple of minor calculations with it. Beyond the charts the BLS provides, that's unique.
On the civilian to employment population, I might be doing some original charting by age bracket and this is in response to Krugman's fudge, which I don't find valid but I know why he did it, the real series he needs isn't available and it has it's merits, but is bugging me due to his fudge.
So, I'm going to try to get the right ones, to make charts with, we'll see.
For now, in spite of this month, it's not like the job crisis isn't horrific, serially, 7.8% by itself is God awful for America's labor market, characteristics.
Anyone applied Benford's law to the numbers?
There are (sometimes) ways of telling if the numbers are manipulated. Here is a good example of a country doing that (on "Bad Science" by Ben Goldacre):
http://www.badscience.net/2011/09/benfords-law-using-stats-to-bust-an-en...
and the Wikipedia link explaining:
http://en.wikipedia.org/wiki/Benford%27s_law
Funny that Greece's statistics should show a marked deviation from the expected distribution. Maybe there are others.
Sweet! Benford's law
I'll check this out, I can certainly run the equations and what a great idea to do!
If you know of someone who has run an AI/analysis algo on U.S. government statistics for manipulation data patterns, (Oh so cool!) can you either write a comment or email us? If the methods are valid, be an awesome cross post or to amplify further.
Neat o, didn't even think about something like this.
Interns "employed" even though working for free? Esp. 20-24
Serious issue here, we all know about the complete explosion of internships that often pay nothing in the last few years, especially in the college-age to a few years out of college/grad school. Many other sites deal solely with this issue. Colleges, grad schools do it to boost their employment stats for grads that couldn't get jobs in this economy. Some grad schools and sectors actually keep their grads employed in jobs only for certain periods shortly after graduation so they show up as "employed" during magazine and other surveys to boost their dismal employment numbers and entice more potential students to spend massive amounts of cash on tuition with dismal job prospects. Private businesses and govt. at all levels also do it. So are these "interns" counted as employed? Because psychologically, self-reporting, of course someone putting in 10-50 hours for anyone is going to feel that of course they are employed and will answer as such during a survey, it's going on their resume, they are putting in the hours and work but just aren't getting paid. So are their bosses, even though they pay no salary. Thus, does this explosion of internships in recent years also cover up a massive loss of paying jobs while showing up as "jobs" that don't pay anything and actually cause the govt. and other businesses and citizens to cover the loss in taxes through free labor? This would again argue strongly for only counting payrolls, salaries, and not relying on self-reporting.
Intern: Of course I'm employed, I'm doing the same work someone else is doing, although I'm not paid for it.
Boss: Sure, he's an intern, does work, but I don't pay him, is he an employee? No. Can I give him orders that he has to follow? Yes.
BLS conclusion: Part-time or full-time "employment" for massive numbers of 20-24 year olds even though not paid.
unpaid workers not counted in CPS as employed
There is a category called "unpaid family workers" which is any person who worked without pay for 15 hours or more per week in a family-owned enterprise operated by someone in their household.
The survey requires someone to have worked during the reference week for "pay or profit".
Unpaid interns are not counted as employed (reference here (pdf). The reference link goes to a 2010 study showing the disturbing trend in teenagers and those under the age of 24 not working.
Now here's one issue they never raise up, how has illegal workers, illegal immigrants impacted stereotypical "youth" jobs? Of course they won't even ask the question of how many illegals are working at those jobs now.
But the trend of "work for free" at professional unpaid internships is a crime! I've seen work descriptions which are really advanced, where someone is supposed to "work for free" as an unpaid intern and that's just exploitation, shouldn't be allowed.
Last I heard there was something called minimum wage in this country, so how these corporations and businesses are getting away with this should be stopped.
You'll have to link up references with the claim colleges are spinning their college students and grad jobs numbers.
There is the reference week which is on the 12th, so if schools pushed up their start dates for classes or something like that, I could see easily that throwing off August and September statistics if there isn't a seasonal adjustment for it, but I haven't dig that deep personally.
That said, why I wrote this in the first place is to show the wide variance in all age brackets which comparing the CPS month to month. Why all of the graphs, every month we see wide swings on many of the CPS components and I'm personally convinced we need to see at least a quarter trend in the CPS to get any sort of real meaning out of some of these figures.
Honestly I full expect the unemployment rate to return to 8.0% in the October figures, we'll see but it wouldn't surprise me.
I know STEM prospects are hyped up because they ignore the foreign guest workers that are counted in the employment stats. Only 8 million jobs total with ~185k in H-1Bs each year alone, each H-1B is good for 6 years, has to be biasing the employment stats to give an illusion there is opportunity for U.S. citizens. The USCIS does not track on how many guest workers are in the country, where they are, where they are working and publish even the top level figures, so we don't know for sure.
Just one example/link grad schools hiring own grads to boost #s
Just one quick link, plenty more in different areas, different schools, different geographic areas. This one covers law schools.
http://blogs.findlaw.com/greedy_associates/2012/04/top-10-law-schools-th...
law schools yes
This is huge, law school is guaranteed 6 figure debt, plus even upon graduation that doesn't mean you're a lawyer, you then have to pass the bar exam, which a large percentage never do.
There is a glut of law school graduates and no jobs.
Could be other universities are doing this in other areas, could be because the semester usually starts around September. Lawyers are a very small percentage, you need to dig out 368,000 phony hires to boost occupational employment statistics, in a month, nationwide.
368,000 and these figures are seasonally adjusted and those adjustments take into account "school's in". If you look at unseasonally adjusted employment figures they vary wildly and that's because we have things like "schools out" for summer, Christmas hiring, seasonal construction (summer) and so on.
That's a lot of bogus hires to boost employment statistics. Look at the two months of August and September it really looks like the survey reference week caught something funky, such as people quitting their summer jobs and taking a couple of weeks before starting their fall part-time job.
I suspect 20-24 year olds went into part-time work here but the seasonally adjusted series isn't available, so cannot say for sure.
The main point of the post is we see wild swings per age bracket pretty much every month with the CPS and those over the age of 55 wild swings I don't think can be explained by college.
So, cherry picking the 20-24 year old employed wild swing this month doesn't fully explain the jump and why this post went into a host of data points to show that. It's part of it, true and if there is something wrong with the survey timing and new college start dates, that could even screw up the seasonal adjustment algorithm, that's true too.
Not true it's all "20-24 yr. olds" that caused the unemployment rate to drop 0.3 percentage points in a month when payrolls added crapola.
illegals given "amnesty" by Obama and employment
Just so people know, I looked into the CPS demographic data available, which isn't seasonally adjusted for ages 18-29 to see if Obama's giving work permits to illegals below the age of 30 showed up in the CPS employment statistics. They started work permit applications on August 15th and in September the first batch were approved. Supposedly they received about 100,000 by that time and would not say how many work permits were approved.
I see absolutely nothing in the employment stats and yes, I pulled all sorts of data out, created ratios, calculated percentage changes, ratios and there just isn't anything there.
The estimates are for at least 1.4 million work permits, so I will be keeping an eye out to see if this impacts employment, but for this month, just did not happen.
I mention this because there are some sites claiming it did and well, uh, no it did not if one looks at the data with any sort of correct ratios and changes.
There is no doubt immigration does impact U.S. labor markets and absolutely no doubt illegal immigration impacts, negatively, labor markets for U.S. workers from reviewing various studies over time, where their assumptions and labor economics equations are valid.
The USCIS, DHS, the BLS, politicians, the Obama administration, the DOL, the Census refuse to accurately monitor immigration, collect accurate statistics by immigration status, how many are in the country, how many guest workers, what occupations, duration, wage statistics, which are all critical data points for U.S. labor markets.
Getting objective, thorough data by immigration statusu is near impossible and one really cannot say much on a month to month change in this regard.
We can get to "foreign born" but that means nothing, for it includes U.S. citizens who were brought over and infants and so on, all it means is someone wasn't born inside the U.S. borders.
Then "Hispanic" has lumped all together anyone who identifies themselves as Hispanic. That means a huge percentage of U.S. citizens, people born here are part of this number. In addition legal residents, guest workers and also illegals are in this figure...
The majority of illegals are from Mexico, but this too is a data skew, for we have illegals from India, Asia and as I recall their inflows recently blew through the roof.
Honestly, if you want to complain about politics being in our statistics, here is an area, labor by immigration status. Can we not find out the truth please? Wouldn't that be nice?
New Job Distribution by Demographics
Search high and low, there is no breakout of new jobs created by the amount of time the successful job candidate has resided in the U.S. There are plenty of USDOL stats by age, and race. There is no stat on how many Visa Workers or new Green Card holders are unemployed.
My theory, entirely anecdotal, is that new entrants to the U.S. labor market have a near zero or very low unemployment rate. This is based on many observations of corporate and govenment offices over the period of the Great Recession and before. MNCs have ways of rotating in Visa Workers from offshore subsidiaries. The foreign consulting firms load the offices with offshore folks who entirely crowd out the dwindling numbers of U.S. workers. This is a an obvious no brainer observation for anyone who has been around the workplace. But there are no official stats, it makes you wonder.
The statistic of New Entrant unemployment will explain how the discussion of New Job creation vs. demographic demand(net births+immigration),
conflates 2 entirely different candidates: the outsourcing of jobs allocated to new entrants from offshore and the increasingly crowded out domestic worker.
Burton Leed
MORE ON AUTOMATED REJECTIONS
Take a look at the link below for a review of a new book by Peter Capelli called "Why Good people Can't get jobs: The Skills gap and what companies can do about it"
The title is misleading because the author's thesis places the blame squarely on the shoulders of the HR departments. I believe that most corporate hiring practices are structured to maximize the longevity of positions within the HR department. If the hiring selection process is reduced down to a sterile alogrithm HR is exonerated from any blame for poor hires (yes I read your earlier article on automated rejections!).
Candidate = 5 years Experience + (25-35 years old) + (JAVA+PEARL+C+ etc) + (HARVARD OR YALE) + ( ).....
Many new corporate sites will not allow you to upload a resume if you can't answer question 1 (experience) or some other factor. I wonder if HR are actively trained in these methods or did they evolve on their own?
http://sciencecareers.sciencemag.org/career_magazine/previous_issues/art...
we wrote about his book earlier, he is right
Automated Job Rejection. Just by forcing people to upload their database instead of respond to an ad with an email and CV attachment is ridiculous. Most would claim HR get in the way of hiring than helping.